Best Social Media Management Tools for Business in 2026
The Best Social Media Tools – Tested on Real Workflows
Our team ran real campaigns to test the top social media tools on real accounts. See the winners for scheduling, analytics, and collaboration – plus who each one suits so you can pick the right fit quickly.


If managing your social media feels like texting with gloves on, it might be time for a tool that works as hard as you do. Whether you need advanced scheduling, detailed analytics, or a unified inbox to keep everything in one place, the right platform can make a big difference. Still, if you’ve never used a social media management tool before, knowing where to start can be tricky.
Maybe you’ve already tried one but found it lacking. It may not meet your needs, whether that means creating channel-specific posts, streamlining team collaboration, or providing more in-depth performance insights.
The best social media management tool depends on your unique needs and goals. If you’re a freelancer or a small business owner, free social media management tools with simple scheduling and content planning features may work for you. On the other hand, if you run an agency, you’ll likely need advanced analytics, team workflows, and scalability.
After extensive testing and research, I’ve narrowed down the 8 best social media management tools for everyone, from individuals to full-service agencies. Read on to find the best option for you.
-

- Advanced (bulk) scheduling
- Unified inbox
- AI pilot for content generation and repurposing
- Deep analytics and reports
- Starting price: $30.00/month
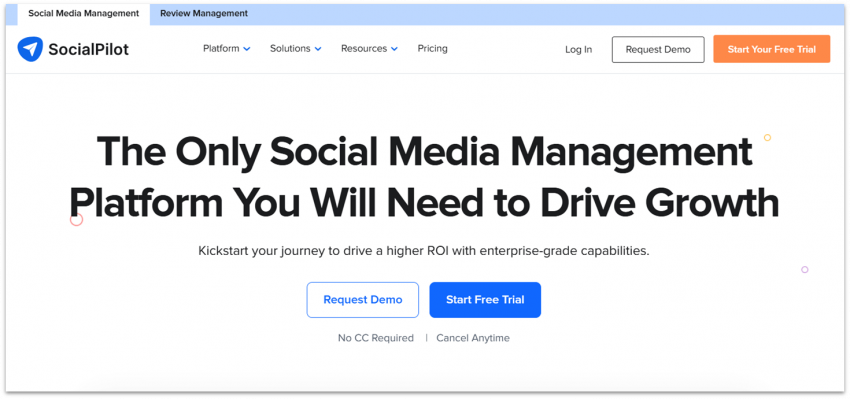
SocialPilot combines enterprise-level features with an affordable price, making it ideal for small teams, growing brands, agencies, and everyone in between. It supports all major platforms, including X (Twitter), Facebook, Instagram, LinkedIn, Pinterest, and Google My Business. It’s also the only tool on this list that works with VK, a popular platform for Russian speakers.
For those needing automation at scale, SocialPilot offers bulk scheduling for up to 500 posts at once, allowing you to publish across multiple platforms with a single click. While it doesn’t track user-generated content (UGC), its AI Pilot automates post creation, helping you generate on-brand, channel-specific posts and quickly repurpose existing material.
You can tell that SocialPilot is designed for collaboration with its full range of team features. Content approval workflows, comment moderation, and Slack integration ensure your entire team stays aligned and productive. SocialPilot also offers white-labeling options, making it one of the best social media management tools for agencies looking to provide custom-branded services to clients.
SocialPilot’s advanced analytics and reporting capabilities allow you to track social media performance with precision. With its intuitive, drag-and-drop interface, you can easily customize your reports by arranging the metrics that matter the most to your business and adding context for easy understanding. You can also save these custom reports as templates to use across platforms, campaigns, and clients.
More on SocialPilot
Visit SocialPilot > -
- AI-powered Smart Inbox
- Advanced analytics and AI-powered social listening
- Robust CRM and third-party integrations
- Competitor performance tracking
- Starting price: $199.00/month
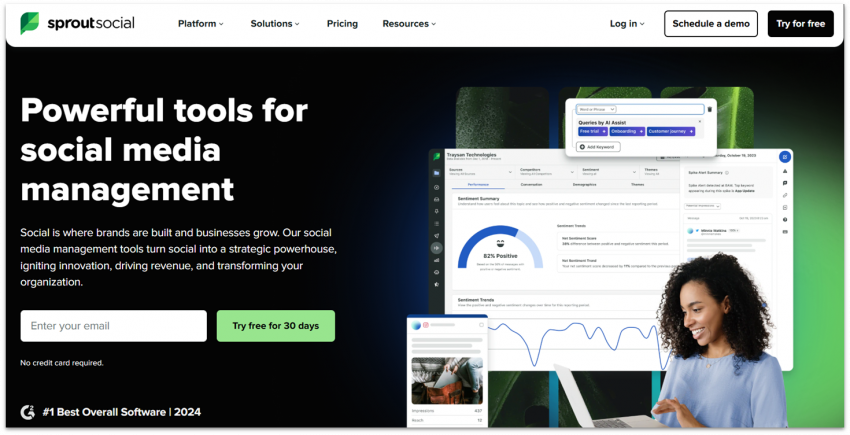
Sprout Social is one of the most feature-rich and powerful social media management tools on this list. While it can support businesses of any size, its higher starting price makes it better suited for larger teams and agencies that need advanced analytics, automation, and collaboration tools.
The platform’s AI-powered engagement suite helps you deliver fast, personalized support at scale. It features a Smart Inbox with chatbot support and AI-generated replies, which in some cases has reduced average response time by over 80%. With Sprout Social’s dedicated bot builder, you can create a customer support chatbot that reflects your brand voice. Additionally, the AI-powered message classifications help you easily identify and prioritize messages that require your immediate attention.
Its social listening tool goes far beyond basic monitoring. Sprout Social lets you track brand mentions, trending topics, sentiment shifts, and keyword performance across platforms in real time. You can also analyze competitor activity, benchmark performance, and uncover opportunities to improve your content strategy.
Sprout Social’s built-in customer relationship management (CRM) system and robust integration stack streamline publishing and audience management. Combined with a customizable content library, helpful tagging system, advanced scheduling tools, and presentation-ready reports, Sprout Social provides all the tools to operate efficiently at scale.
More on Sprout Social
Visit Sprout Social > -
- Advanced publishing features
- Content suggestion engine
- Client access without password sharing
- While-label solutions
- Starting price: $29.00/month
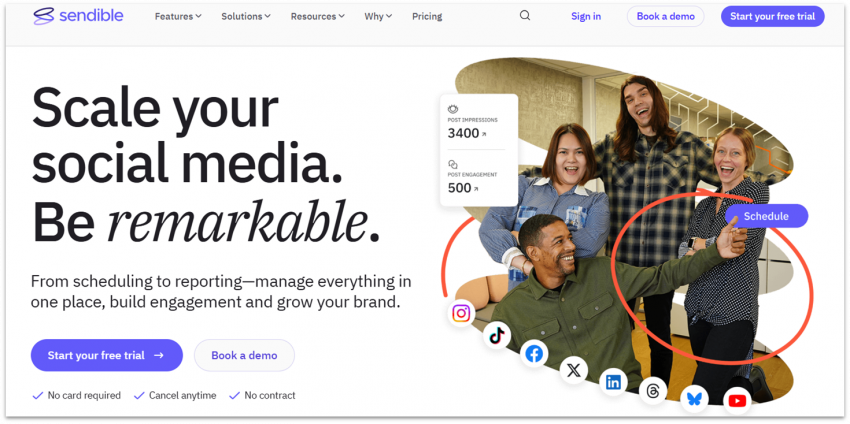
Sendible is a flexible, feature-rich platform suitable for agencies, freelance marketers, growing brands, and small business owners. It offers an affordable starting plan and supports all major platforms, including X, Facebook, Instagram, LinkedIn, Pinterest, and YouTube. You can even publish to blogging platforms, Facebook Ads, and Google Business Profiles.
It stands out for its advanced scheduling capabilities. Sendible’s Smart Queues feature lets you recycle and schedule evergreen content regularly without manual intervention. You can also organize posts into campaigns. Combined with its social listening tools, Sendible simplifies performance tracking and content strategy planning.
Content creation is supported with access to high-quality media through Canva, GIPHY, and Pexels, as well as built-in AI tools. Unlike SocialPilot, Sendible offers unlimited AI capabilities on all plans, including lower-tier ones. It also features a native content suggestion engine that recommends trending and relevant topics based on your audience and niche.
For agencies and marketers managing multiple clients, Sendible provides secure profile access without password sharing and custom-branded reports. You can also manage engagement for multiple clients at scale with features like Priority Inbox, which centralizes all social media interactions, and Social Feeds that let you oversee real-time updates for all connected accounts.
More on Sendible
Visit Sendible > -
- Brand monitoring tools and social listening
- AI-powered local SEO automation
- Local listings management
- Employee advocacy tools for organic social growth
- Starting price: $149.00/month
eClincher is the only platform that combines social media management, brand monitoring, local SEO, and listings management. This makes it an excellent choice for multi-location businesses and brands focused on driving foot traffic or attracting local clients.
The platform offers powerful social tools, including smart scheduling, AI-powered content creation, and post recycling capabilities. Additionally, with its link-in-bio tool, you can consolidate all your important URLs into a custom landing page to drive traffic to your site, online shop, or even specific product pages. eClincher also stands out with its employee advocacy tools that let your team share your brand’s content with one click, boosting your organic reach.
Its brand monitoring and social listening tools let you track brand sentiment and interactions across platforms, as well as respond quickly to mentions or reviews – all from one central inbox. You can also benchmark against competitors using its built-in analytics.
For local SEO, eClincher offers AI-driven tools to automate citation building, listing updates, and reputation management. It connects to platforms like Google Business Profile and Yelp to ensure your business information is always accurate and visible in local search.
More on eClincher
Visit eClincher > -
- Free and affordable plans
- Influencer marketing services
- UGC tool
- Link in bio builder
- Starting price: $0/month
Later is primarily built for Instagram, but it also supports platforms like Facebook, TikTok, Pinterest, LinkedIn, and X (formerly Twitter). However, its feature set is more limited compared with other tools on this list. It also lacks some advanced tools, such as a chatbot editor and CRM, making it less suited for large teams or agencies that require more scalability.
However, Later is a great choice for freelancers, small teams, and social media managers on a tight budget, thanks to its free plan and affordable pricing. It’s also beginner-friendly, with an intuitive interface that’s easy to navigate.
You get standard tools like automatic scheduling and publishing, as well as AI-powered content creation tools, and a link in bio builder to drive traffic from your social media. Later also offers a UGC tool that makes it easy to discover, collect, and share user-generated content across your social channels. This not only saves time on content creation but also helps strengthen brand authenticity and community engagement.
Beyond social media management, Later includes social listening and influencer marketing services. You can monitor brand mentions, track trends, and connect with relevant creators to expand your reach and build social proof.
More on Later
Visit Later > -
- Abundance of built-in design tools
- 25+ AI tools for content generation and editing
- Magic Switch™ transforms designs
- Hundreds of social-media-ready templates
- Starting price: $14.99/month
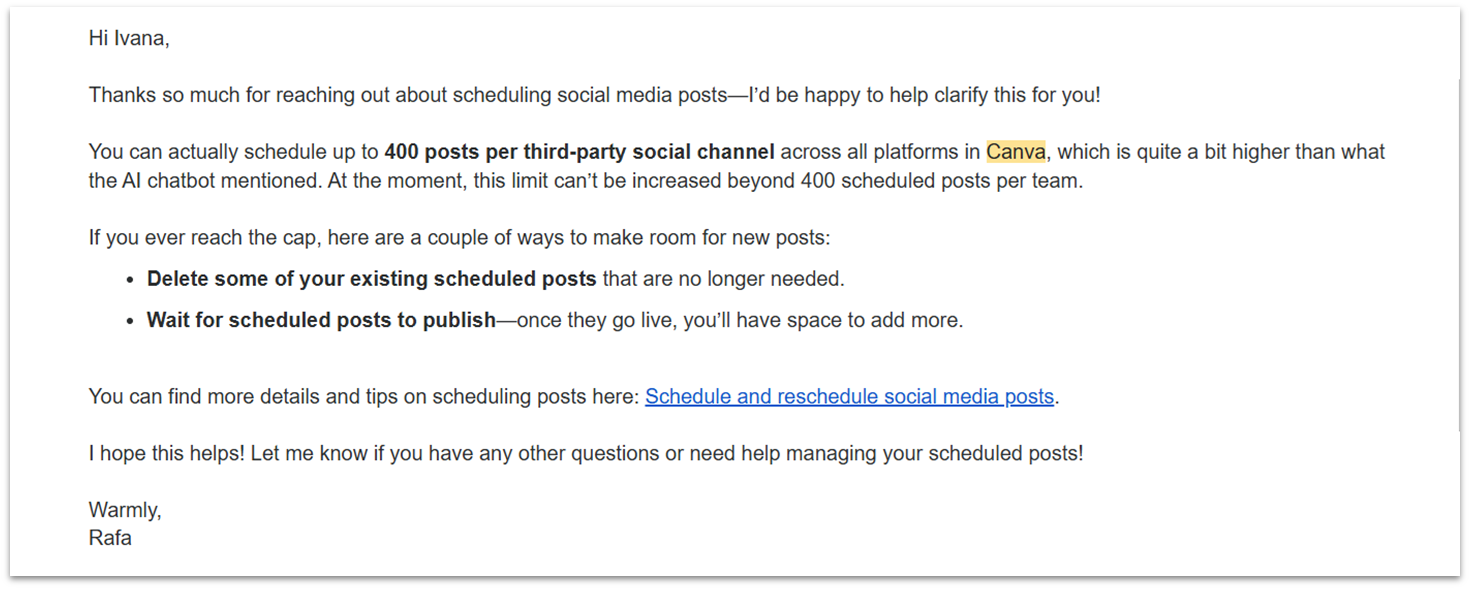
Canva is primarily a design platform with basic content planning features, making it a suitable fit for influencers, content creators, and small businesses that focus on visual storytelling. It supports Instagram, Facebook, Pinterest, Twitter, LinkedIn, Slack, and Tumblr, though it doesn’t integrate with YouTube and TikTok.
Canva’s social media scheduler is only available on paid plans, and its features are fairly limited. It lacks key capabilities for professionals or socially active brands, such as bulk scheduling, simultaneous cross-platform publishing, advanced analytics, message automation, and CRM tools.
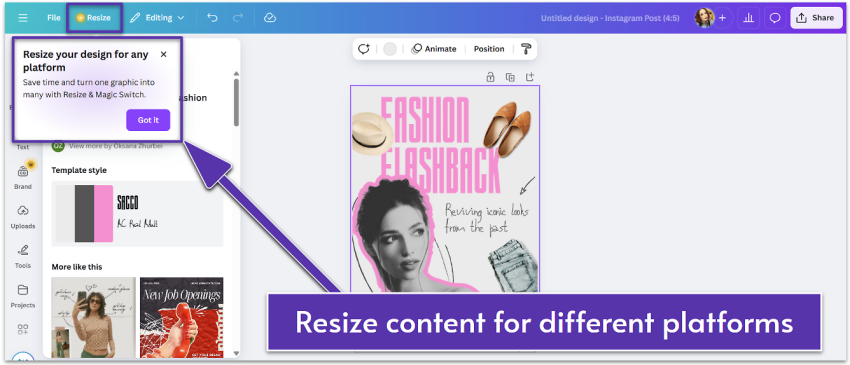
That said, Canva offers a robust ecosystem of design tools and hundreds of social media templates, which makes it ideal for visual-first creators. Its Magic Switch™ feature is a significant time-saver for those active on multiple platforms, effortlessly transforming designs into different formats. For example, you can turn a graphic into an Instagram post and even translate it into various languages in just a few clicks.
Overall, Canva works best for recreational or semi-professional use rather than agency-level needs.
More on Canva
Visit Canva > -
- Personal AI-powered social media assistant
- In-depth analytics on all your social media content
- Social inbox with team permissions
- Shared content library for teams
- Starting price: $149.00/month
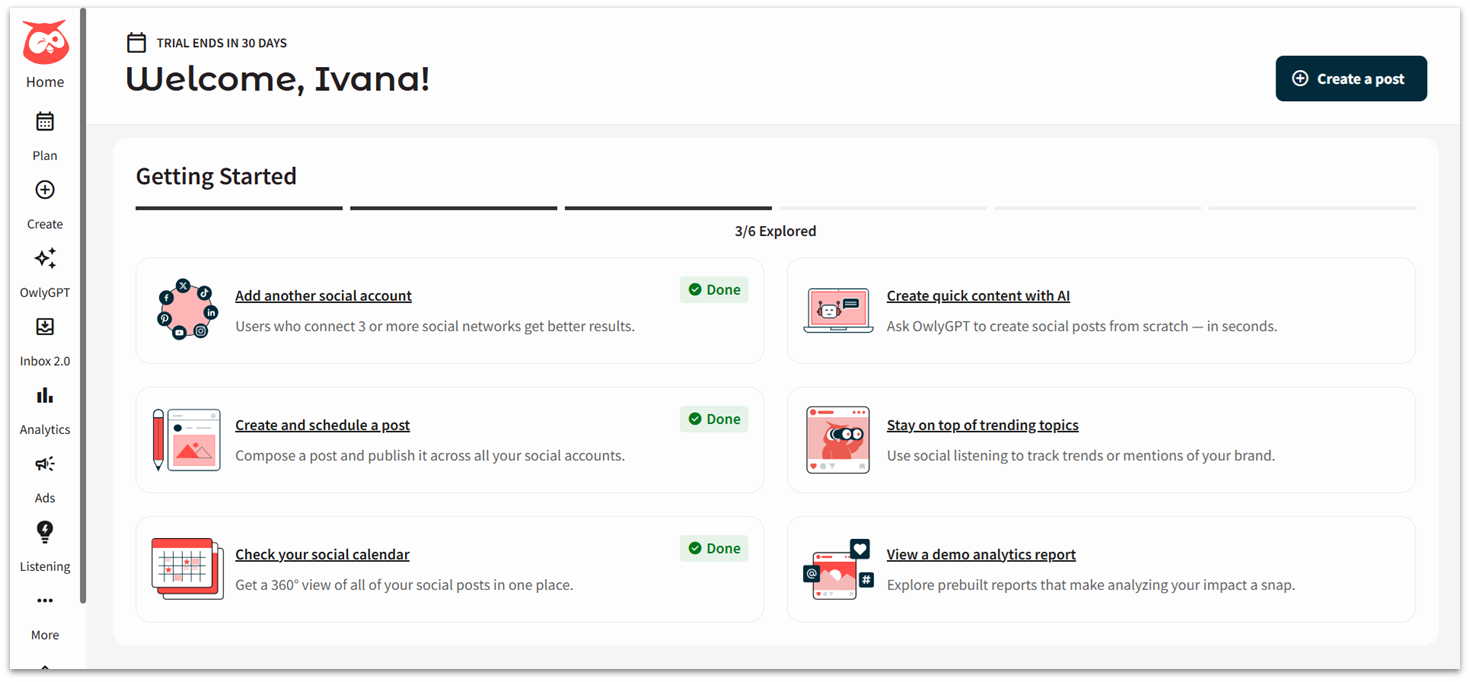
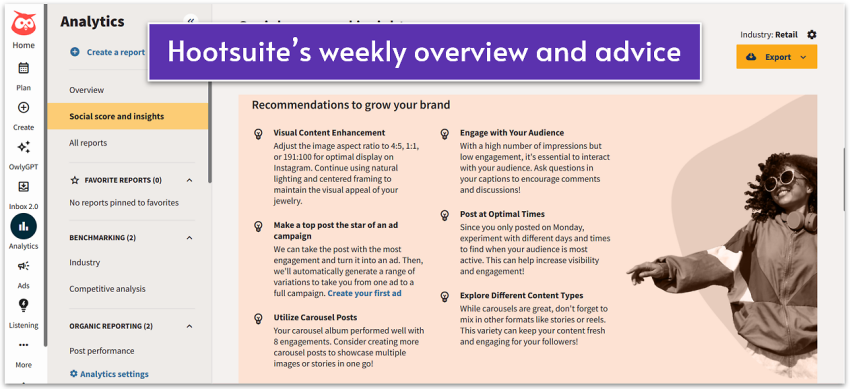
Hootsuite is a great choice for businesses and agencies thanks to its comprehensive social media management features. It offers a conversational AI tool, OwlyGPT, that you can train on your brand voice and visual identity. You can then use it as a personal assistant to generate campaign ideas, create brand-consistent posts, give strategy advice, and analyze how people perceive your brand.
Its social inbox streamlines team communication by consolidating messages from all your social channels into one place. Features like saved and suggested replies speed up responses, automated Instagram DMs boost engagement, and smart message routing ensures inquiries reach the right team members. Additionally, you can handle communication as a team with shared access, message assignments, and internal notes.
Hootsuite stands out with its in-depth analytics, which track all your social media activity – even posts made outside the platform – to give you a complete picture of your strategy’s performance. Its advanced reporting tools enable you to customize dashboards, monitor key performance metrics, and identify top-performing content to refine your campaigns effectively.
It’s worth mentioning that Hootsuite no longer offers a free plan and starts at a higher price point than many of the recommendations on this list. However, businesses and agencies that prioritize data-driven decision-making and want personalized AI assistance will find great value in this social media management tool.
More on Hootsuite
Visit Hootsuite > -
- Simple, easy-to-navigate interface
- Capture and store content ideas
- Group channels for easy bulk scheduling
- AI assistant for content refinement and repurposing
- Starting price: $0/month
Buffer is a popular choice among individuals, freelancers, and small business owners. Buffer offers a generous free forever plan and affordable paid options – though pricing is based on the number of channels you manage. It supports posting to Facebook, Instagram, LinkedIn, X, and Pinterest (paid plan only), with the ability to post to multiple accounts per platform.
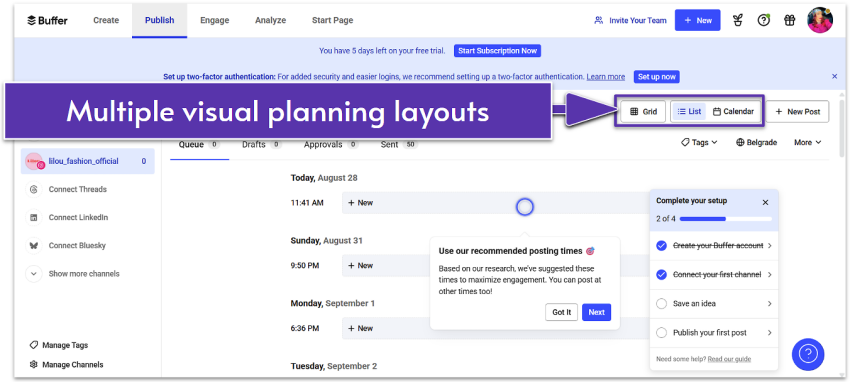
Buffer features a clean, modern interface that simplifies content planning. You can store ideas in kanban-style columns, create a queue of posts, and set reminders for native posting on selected platforms. You can also group channels for bulk scheduling, schedule first comments on Instagram and LinkedIn, and store tags you want to reuse.
In addition to the essentials, Buffer includes some handy extras, such as a Start Page (a link-in-bio page) and a built-in link shortener. However, its engagement features are limited to replying only on Facebook and Instagram.
The free plan includes basic analytics with engagement data on individual posts from the past 30 days, but you’d have to upgrade for deeper insights. Overall, Buffer is a great choice for those seeking effective content management and scheduling with minimal frills.
More on Buffer
Visit Buffer >
What I Looked For in the Best Social Media Management Tools
When evaluating the best social media management tools, I focused on a range of factors to meet the needs of freelancers, brands, small business owners, and agencies alike. Here’s what I prioritized:
- Supported platforms. I gave more points to tools that support a range of social media channels. However, I also included some basic, affordable options for those with simpler needs.
- Scheduling and content tools. I looked for features, such as bulk scheduling, cross-platform posting, and one-click publishing, that streamline workflows without requiring constant manual effort. I also included options with built-in design tools, social-ready templates, AI content generation capabilities, and a visual content calendar that makes it easier to plan posts.
- Collaboration and engagement features. Platforms with approval workflows, role-based permissions, and shared calendars make team collaboration more manageable and efficient. For engagement, I looked for tools with unified inboxes and chatbot support to help speed up responses and streamline interactions.
- Analytics and reporting. Aside from platforms that provide insights and reports, I included options with social listening capabilities and those that let you create branded reports when sharing results with clients.
- Ease of use. My top recommendations offer clean, intuitive interfaces that let you focus on creating, planning, and engaging, rather than figuring out how to use the software.
- Reliability, scalability, and value. I tested the platforms to ensure they perform consistently without downtime. I also looked for options that can grow with your needs as you expand. The social media management tools on my list strike a balance between functionality and affordability, ensuring you get the most for your money.
The Best Tools for Social Media Management Compared
Here’s a quick overview of how these social media management tools stack up, so you can find the right fit for your needs.
| Standout Feature | Best For | Supported Platforms | Free plan | Starting price | ||
|---|---|---|---|---|---|---|
| SocialPilot | Advanced scheduling | A variety of businesses of any size | X, Meta, LinkedIn, TikTok, Pinterest, Tumblr, YT, Bluesky | ✘ | $30.00 | |
| Sprout Social | AI-powered engagement suite | Larger businesses and agencies | X, Meta, TikTok, YT, LinkedIn, Pinterest, |
✘ | $199.00 | |
| Sendible | Advanced publishing tools | Client-serving agencies | Meta, X, LinkedIn, YT, TikTok, Bluesky | ✘ | $29.00 | |
| eClincher | Social management & brand monitoring | Multi-location brands and businesses | Meta, X, LinkedIn, YT, TikTok, Pinterest, Bluesky | ✘ | $149.00 | |
| Later | Free and affordable plans | Individuals and small businesses | TikTok, Facebook, Pinterest, LinkedIn, X | ✔ | $0 | |
| Canva | Multiple design tools | Content-first small businesses and creators | FB, Insta, X, Pinterest, LinkedIn | ✘ | $14.99 | |
| Hootsuite | Comprehensive analytics | Businesses and agencies | Meta, TikTok, X, YT, LinkedIn, Pinterest | ✘ | $149.00 | |
| Buffer | Great free plan | Individuals, freelancers, and small businesses | Meta, Pinterest, X, YT, Mastodon, LinkedIn, Bluesky | ✔ | $30.00 |
My Experience With the Best Social Media Management Tools
I tested each of the top tools for social media management, paying close attention to how they perform in real-world use. From setup and usability to the quality of analytics, collaboration tools, and publishing workflows, here’s my take on what it’s actually like to work with them day-to-day.
#1 SocialPilot – Best SMM Tool Overall
Ease of Use
SocialPilot’s interface is clean and lightweight, yet surprisingly powerful. When I first logged into SocialPilot, I immediately felt supported – a pop-up window asked if I wanted to schedule a personalized demo. The platform felt intuitive from the start, with no steep learning curve or second-guessing where to click.
Scheduling, Content Planning, and Publishing
SocialPilot offers some of the most advanced scheduling features, allowing you to schedule posts, stories, and even first comments across multiple platforms simultaneously. It supports bulk scheduling of up to 500 posts – more than most competitors. It even allows bulk video scheduling, which pricier tools like Sprout Social don’t offer.
You can also leverage the SocialPilot AI Scheduler, a custom GPT integrated with your account, to plan campaigns, generate content, store drafts, and schedule posts with ease.
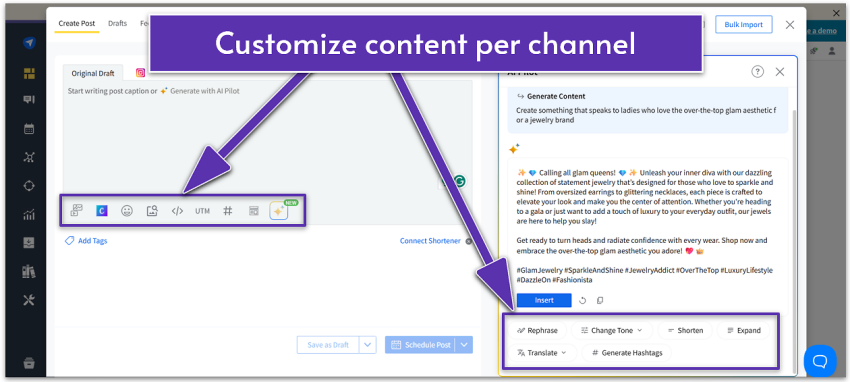
The AI Pilot helped me create content quickly, including relevant hashtags. This tool can also tailor each piece for different channels and quickly repurpose your top-performing posts. The Canva, Unsplash, and Giphy integrations are a big plus, saving me from switching between tabs while designing social posts. I also found the post tagging feature very helpful for quickly pulling up a specific post, rather than searching for it manually.
Analytics and Reporting
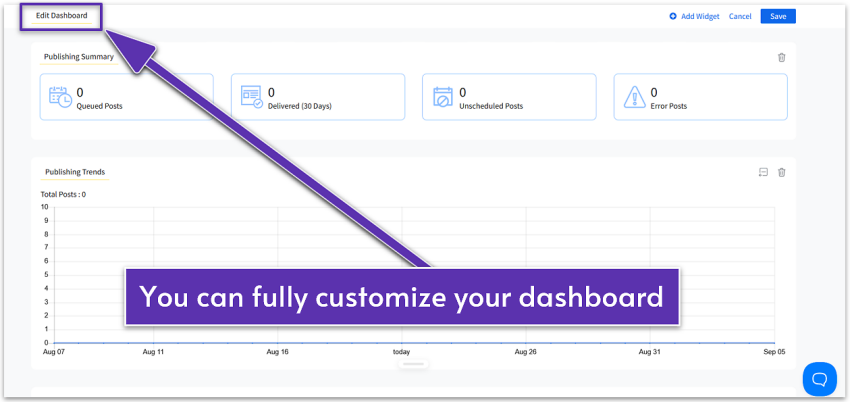
When it comes to analytics, SocialPilot provides detailed insights with the data and context needed for making smarter decisions. What stood out most was the personalization: you can customize dashboards by platform, highlight key metrics, and track progress without having to sort through irrelevant data.
SocialPilot also lets you build custom reports with drag-and-drop elements, and once you’ve created the ideal setup, you can save it as a reusable template. Reports can be scheduled for automatic delivery or shared via a link. The Live Data feature, which allows you to preview PDFs with real-time analytics, is a huge bonus.
Team Management & Engagement Features
SocialPilot simplifies team collaboration by allowing you to add clients, assign roles, and manage permissions. You can collaborate on drafts and coordinate efforts with your team on campaigns through the cohesive all-in-one social media calendar. Teammates can also pull from the content library to repost saved material or reuse hashtags, text, and media.
For agencies or freelancers managing multiple clients, SocialPilot’s Approvals-On-The-Go feature is a standout. Clients can review and approve posts directly from their phone, tablet, or PC – no SocialPilot login required.
The unified inbox allows you to reply to Facebook, Instagram, and LinkedIn messages and comments. I tested the AI Pilot within the inbox, and it generated brand-aligned replies from just a short prompt. SocialPilot’s AI-supported unified inbox enables significantly faster and easier customer communication across multiple accounts.
SocialPilot also offers review and reputation management software that helps you collect and manage customer feedback. While SocialPilot Reviews comes at an additional cost, it’s fully integrated into the same interface as the social media management platform, so you can handle both reviews and social content without switching between dashboards.
Scalability & Pricing
SocialPilot combines affordable pricing and support at any scale. Freelancers or small business owners managing a handful of accounts can start for as low as $30.00. Agencies can still manage multiple accounts affordably, whether by purchasing a fitting plan or adding more users and accounts for a low fee to any plan. While there’s no free plan, SocialPilot’s pricing is one of the fairest I’ve seen in the industry for the features it offers.
Support
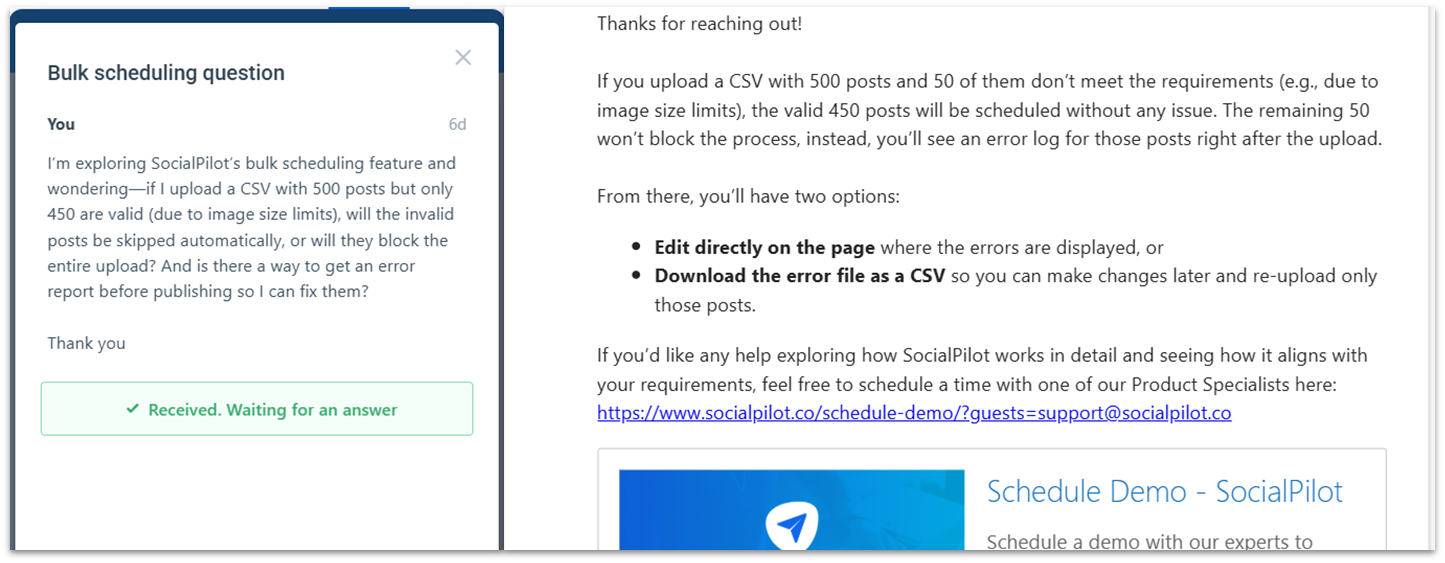
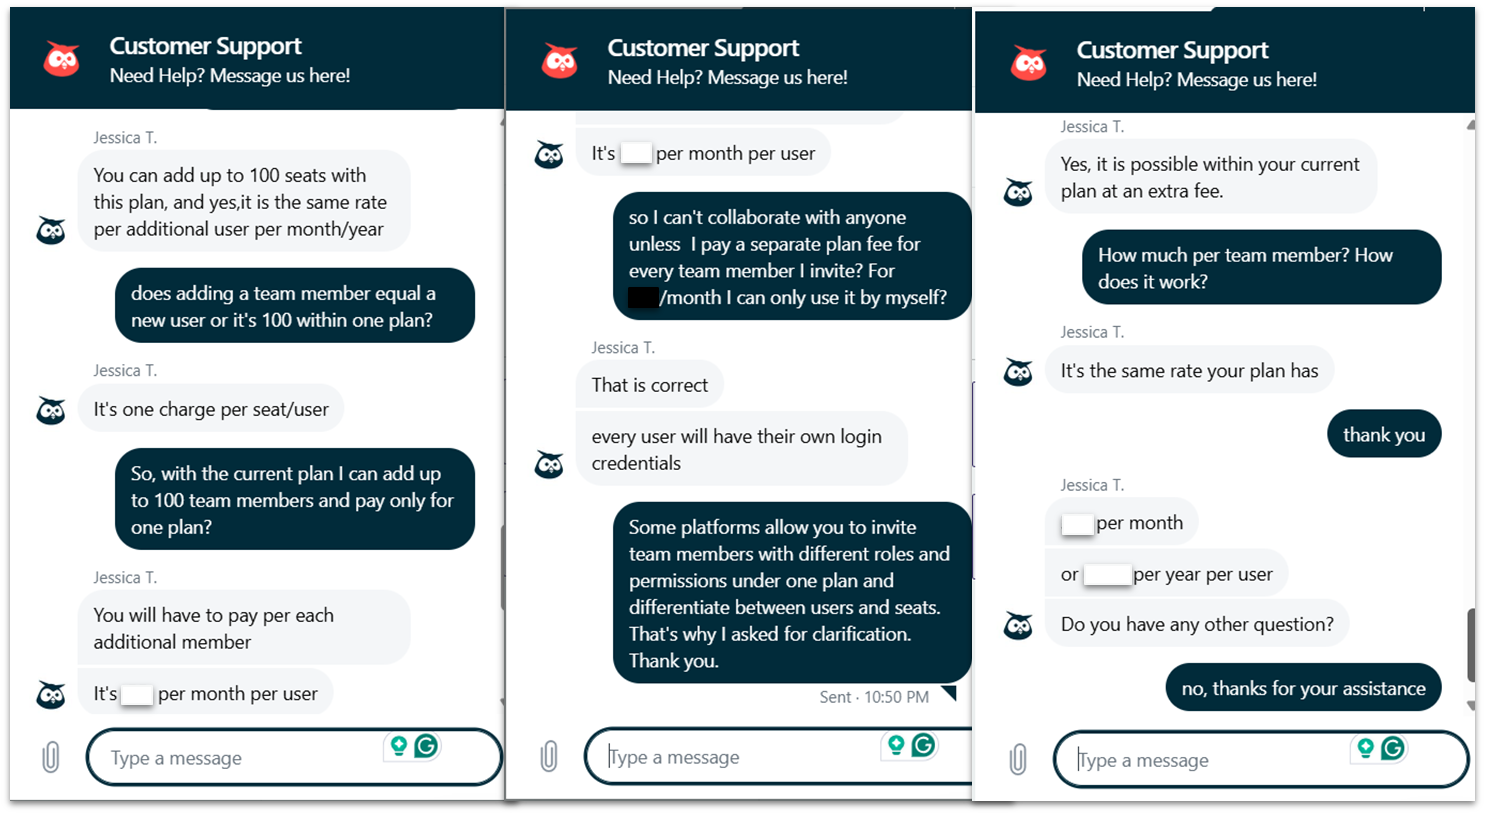
SocialPilot offers support via phone, email, chat, and its mobile app, available 24/5 on all plans, along with a comprehensive knowledge base. I tested its support by submitting a query late Friday, and I received a detailed response by Monday, which was reasonable given that support isn’t available on weekends. I was impressed by the depth of the reply, and even more so when a second agent followed up to ensure my issue was fully resolved.
#2 Sprout Social – Best for Midsize-to-Enterprise Teams
Ease of Use
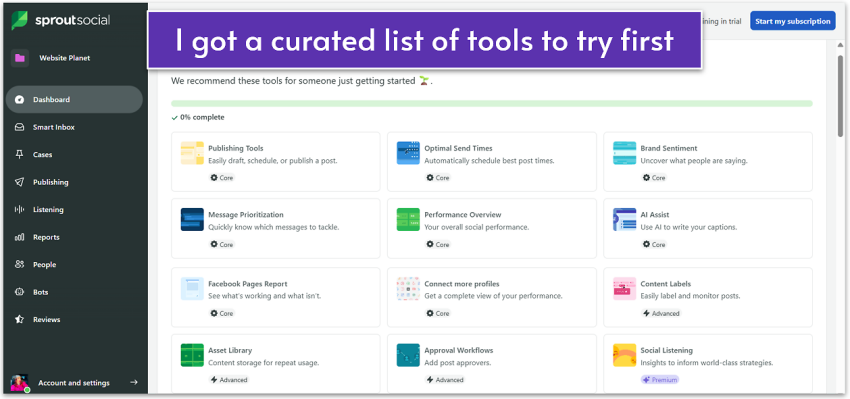
Sprout Social feels like walking into a well-designed office – everything’s polished, but you still have to learn where the supply closet is. Thankfully, Sprout Social prepared a list of tools I should try as a beginner, and I immediately felt less overwhelmed. The onboarding tutorials provided me with a solid foundation, and once I got into the groove, the workflow felt natural.
Sprout Social is not quite as “click and go” as leaner tools like Buffer, but the extra depth is worth the small adjustment period.
Scheduling, Content Planning, and Publishing
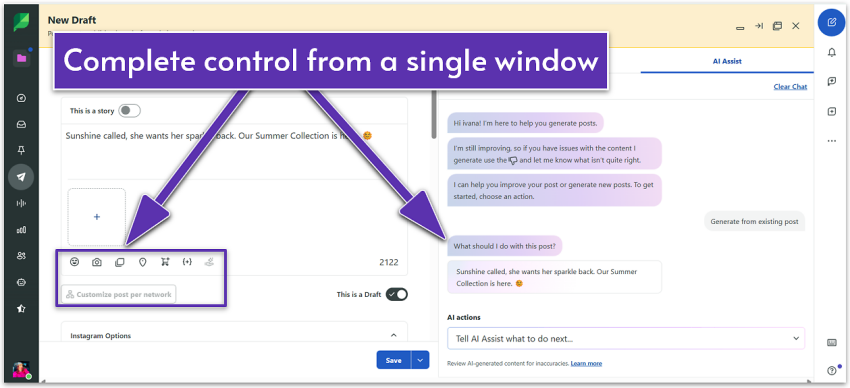
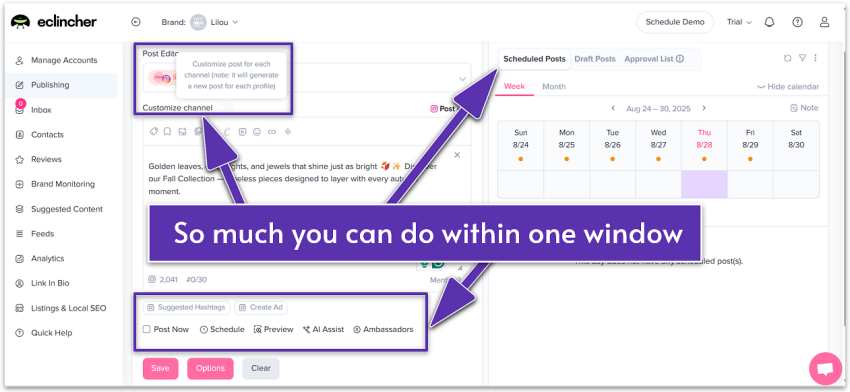
Sprout’s publishing tools are top-notch. I was impressed by how much I could do in a single window, from drafting posts with AI assistance and tailoring them for each network to promoting them through Ad Manager.
Sprout Social’s partnership with ViralPost® eliminates the guesswork in scheduling by identifying your optimal posting times and highlighting them for either automated or manual publishing. I got optimal send time suggestions based on my time zone, which were impressively accurate in my tests.
However, bulk scheduling is capped at 350 posts and stories – and that’s if you subscribe to higher-tier plans. I was also quite disappointed to learn that an agency-grade tool like Sprout Social doesn’t support scheduling videos in bulk, whereas small-business-friendly options like SocialPilot do.
Analytics and Reporting
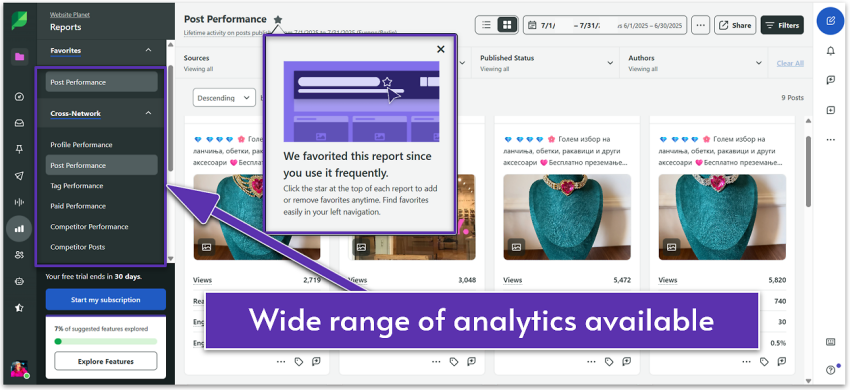
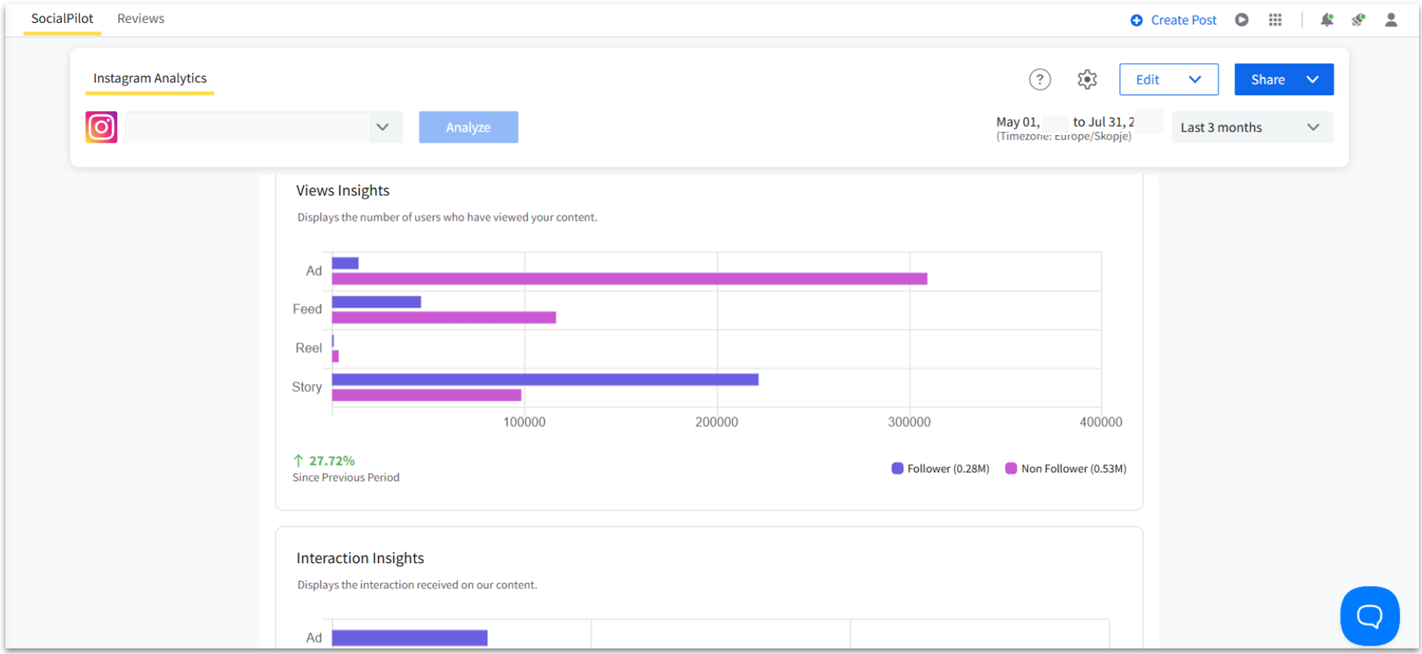
My tests show that the level of detail in Sprout Social’s reporting is unparalleled. You can track performance by post, content type (e.g., image, video, carousel), profile, tag, and paid ads. You can also easily oversee the competition and benchmark your performance against it.
The Internal Performance category, for example, is entirely dedicated to providing you with data and insights on specific efforts within your team, like publishing, communication, including Instagram bots, and employee advocacy.
Other advanced features include organizing inbound social media messages into structured “cases.” This allows you to track case efficiency, assignee performance, case volume in a specific period, and more. Overall, Sprout Social’s analytics and reporting deliver more metrics and deeper insights than any other option on this list.
Team Management & Engagement Features
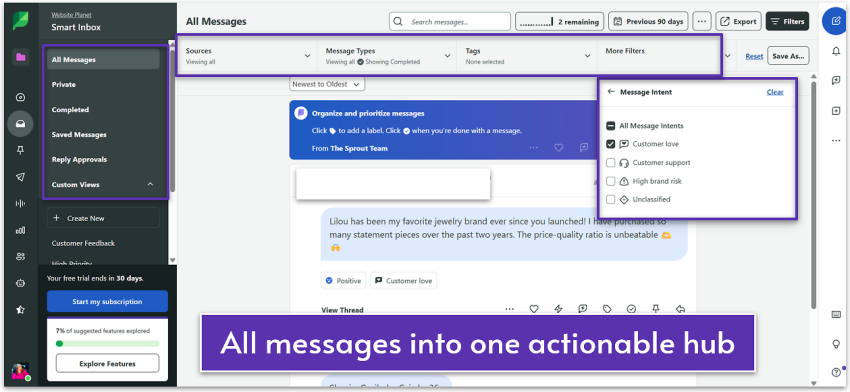
Sprout Social’s Smart Inbox is more advanced than most unified inboxes I’ve tested. It uses machine learning to detect message intent (e.g., “Customer Love” or “High Brand Risk”) and automatically categorize incoming messages. Moreover, sentiment filters (“Positive,” “Negative,” “Neutral”) give managers instant oversight of brand perception.
It consolidates private messages, comments, and mentions across platforms, and goes far beyond simple tags or assignments. The “Custom Macros” feature, for example, allows you to create workflows comprising multiple actions and apply them with a single click. I also found “Spike Alerts” particularly useful for brands and agencies, as it flags sudden surges in message volume, allowing you to respond to opportunities or crises right away.
Scalability & Pricing
Teams and agencies will find Sprout Social robust enough to handle just about anything. But that power comes at a cost, starting at $199.00 per user and up to 5 social media profiles. Unlike SocialPilot, Sprout Social doesn’t let you add more users to the same plan for a small fee.
Thankfully, you won’t have to buy separate plans to collaborate with team members. Sprout Social enables you to create individual logins with distinct permissions for team members within a single plan. That said, Sprout Social is still more expensive than most tools I tested; however, if you can afford it, you’ll gain access to capabilities that are hard to match elsewhere.
Support
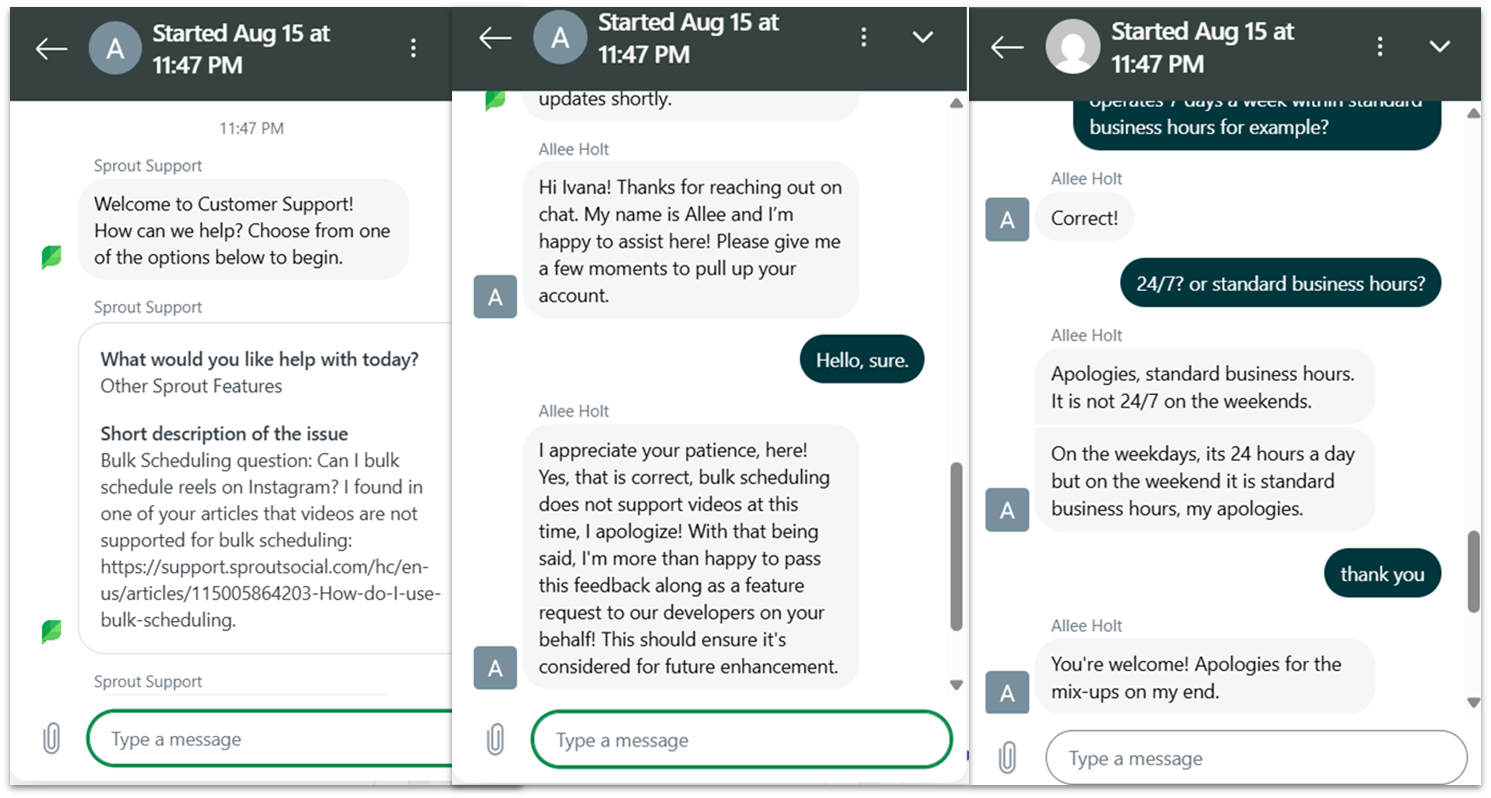
Human support is available 24/5 and operates standard business hours during weekends via email/ticket, live chat, and phone, Monday through Friday, 6 AM EST – 8 PM EST. I sent a chat request directly from the dashboard, and an agent responded with a detailed answer within minutes.
#3 Sendible – Best for Client-Serving Agencies and Freelancers
Ease of Use
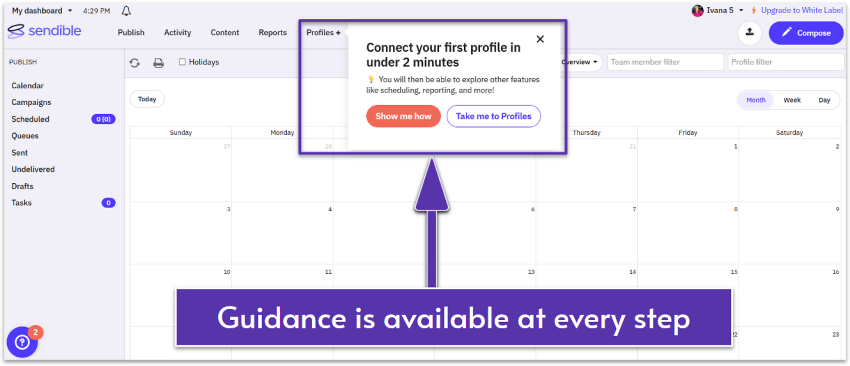
This tool struck me as “quietly powerful” – Sendible’s interface is minimalist, but holds a lot of depth. Connecting accounts, setting up queues, and customizing posts for each platform is straightforward, making it easy to get started quickly.
Scheduling, Content Planning, and Publishing
It has a clean drag-and-drop calendar that makes it easy to plan and rearrange posts as needed. And, Sendible’s content suggestion engine and social listening tools help surface trending, relevant topics, making it easier to post content your audience will actually engage with.
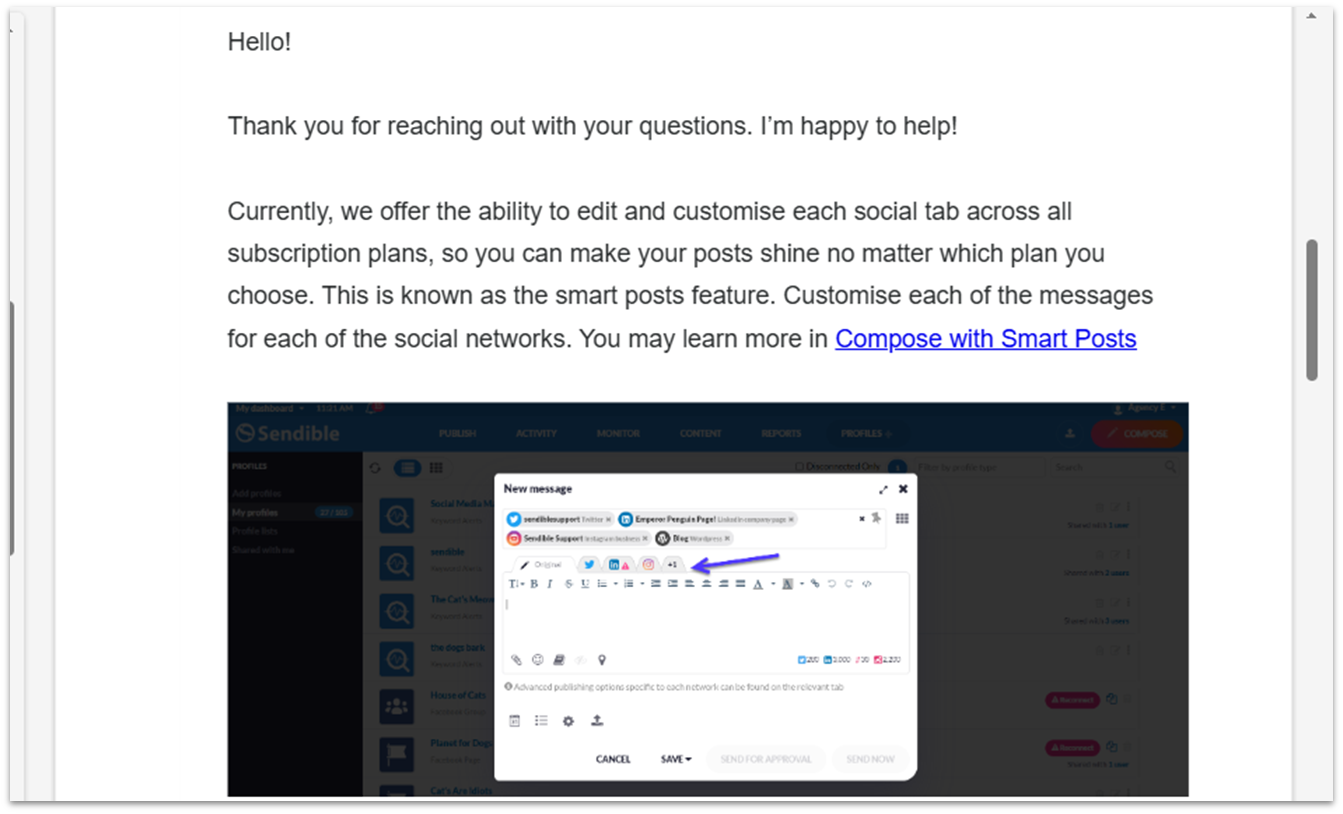
I find Sendible’s post customization features to be quite strong, on par with more expensive options like Sprout Social. The “Smart Posts” feature enables you to tailor messages for different platforms, adjusting for character limits, image formats, and platform-specific nuances directly from the “Compose Box.”
Sendible’s Smart Queue feature ensures your top posts never go to waste, helping you maintain a consistent social presence even on your busiest days. You can automatically recycle evergreen content that you have published in the past, like testimonials, quotes, and other posts, by adding them back into the queue.
Analytics and Reporting
Reporting is simple yet powerful with one-click reports. You can generate performance reports for each social network individually or combine data across all your channels into a single view. This flexibility allows you to track the bigger picture or zoom in on each platform’s performance.
Additionally, Sendible’s report builder lets you create tailored reports that highlight the metrics most important to your business. Agencies and freelancers can apply custom branding for a professional look. Furthermore, Sendible integrates with Google Analytics, consolidating social and website data into a single dashboard.
Team Management & Engagement Features
Sendible includes standard collaboration features such as assigning posts and roles, creating client-specific dashboards, and adding team members. While its engagement tools aren’t as advanced as Sprout Social or Hootsuite, Sendible offers more functionality than simpler options like Canva or Buffer. The Priority Inbox centralizes messages from Facebook, Instagram, LinkedIn, and YouTube, and analyzes sentiment to help you spot urgent queries.
Scalability & Pricing
Sendible works well for individuals, small teams, and agencies alike due to the low-priced entry plan and reasonably priced higher-tier plans. It’s a scalable option as the number of users and social media profiles grows generously with each higher-tier plan. However, it’s worth noting that comparably priced options, such as SocialPilot, might offer more flexibility and features depending on your specific needs.
Support
Sendible offers support via live chat and email through a ticket system, Monday through Friday, 8:00 a.m. – 8:00 p.m. GMT (summer) or 9:00 a.m. – 9:00 p.m. GMT (winter). I submitted a query late Sunday and received a response Monday, complete with thorough explanations, screenshots, and links to additional resources – a level of detail I rarely see. Sendible’s knowledge base is just as comprehensive.
#4 eClincher – Best for Multi-Location, Local-SEO-Driven Brands
Ease of Use
When I first opened eClincher’s dashboard, I’ll admit it felt a bit overwhelming. There’s a lot packed into one place, and it took me some time to get familiar with it. But the more I explored, the more I saw how logically everything is organized.
For example, the post editor and the content calendar appear in the same window, allowing you to create, plan, schedule, and promote without switching tabs. Once I got past eClincher’s initial learning curve, the workflow felt surprisingly smooth.
Scheduling, Content Planning, and Publishing
eClincher offers robust content tools designed to save time, along with AI capabilities that outpace most competitors. Its AI can generate posts from prompts, draw inspiration from your website and social accounts, or research and create content from scratch – then tailor it for each channel. The detailed, visually appealing calendar view makes it easy to spot gaps, balance content types, and refine your posting strategy at a glance.
Moreover, features like Queues help you organize posts into categories for automated publishing. eClincher’s bulk scheduling caps at 100 posts, which is not bad, but well below SocialPilot’s 500.
There’s also a unique option to update profile covers across all platforms at once, which makes it easier to maintain consistent branding, especially if you change them often for seasons or campaigns. The built-in Canva integration is very handy, allowing you to create visuals without needing to switch apps.
Analytics and Reporting
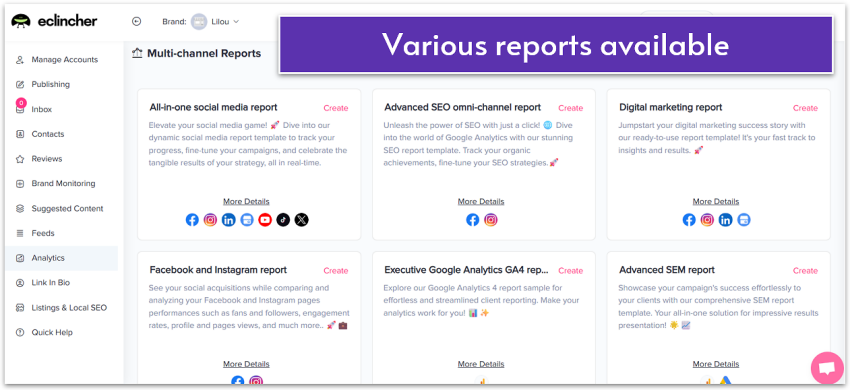
The analytics dashboard is comprehensive, covering everything from profile and post performance to competitor reports. eClincher stands out with its advanced multi-channel reports, offering a deeper dive into various aspects, including SEO, SEM, paid advertising, email campaign performance, and more. Still, its reports lack the type of actionable advice you’d find at some more robust platforms, like Hootsuite.
Higher-tier plans include AI analytics, brand monitoring, and social listening tools. What stood out to me is that, unlike cheaper alternatives that only provide very basic metrics on entry plans, eClincher includes advanced analytics across all plan levels.
Team Management & Engagement Features
Features like role and task assignments keep everyone accountable. There’s also an approval workflow and a role (approver), which lets clients or team members see and comment on posts without access to the eClincher app.
The unified inbox streamlines engagement by consolidating messages and mentions from all connected profiles. While tools like Sprout Social offer a more feature-rich inbox at a similar price point, eClincher still packs in valuable advanced features, including AI-powered auto-replies and sentiment analysis.
Beyond the inbox, eClincher is one of the rare social media management platforms to offer employee advocacy tools that enable you to amplify your brand reach through employees’ voices.
Scalability & Pricing
Compared with tools like SocialPilot and Sendible, eClincher pricing may seem high. However, even the entry plan comes with advanced features, such as automation workflows and comprehensive analytics.
The higher price is especially worthwhile if you need tools such as brand monitoring, local SEO, and listings management. These are also available as add-ons. You can add more users and profiles (up to a specific limit) to any plan for an extra fee, making eClincher a great all-in-one, scalable solution for growing brands.
Support
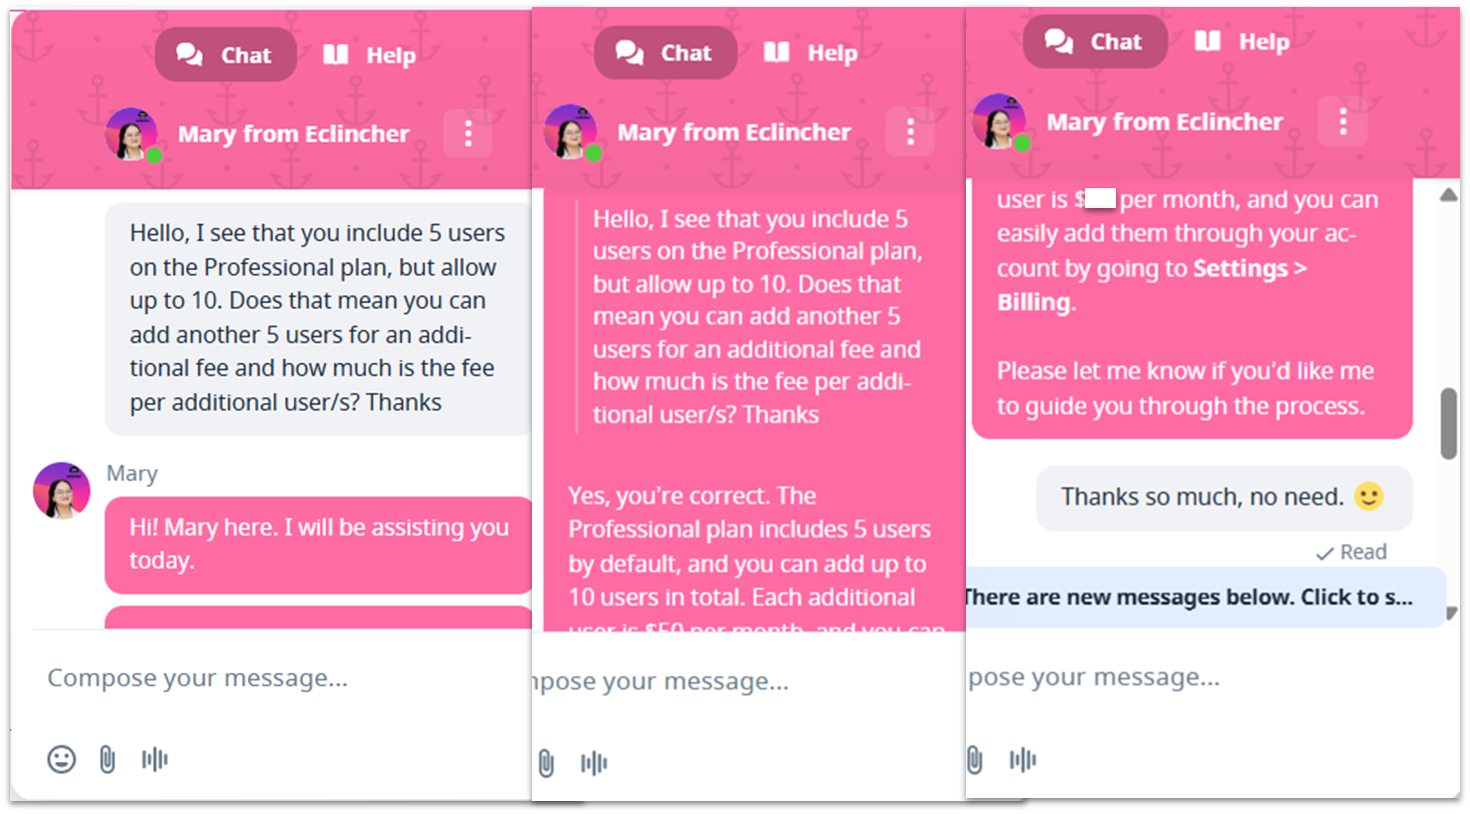
You can contact eClincher via live chat or email. eClincher’s support impressed me more than most tools in this roundup. While its knowledge base felt limited, the live chat more than made up for it with its fast and helpful responses. Personally, I’d take direct access to a real human over wading through endless support articles any day.
#5 Later – Best for Instagram-Led Small Teams and Creators
Ease of Use
I experienced a few bugs and errors trying to connect a business Instagram account on Later. After I finally did it, I found Later to be one of the easiest social media management tools to use. It’s not as feature-packed as SocialPilot, Sprout Social, and eClincher, but it offers more than enough, especially if your primary focus is Instagram.
Scheduling, Content Planning, and Publishing
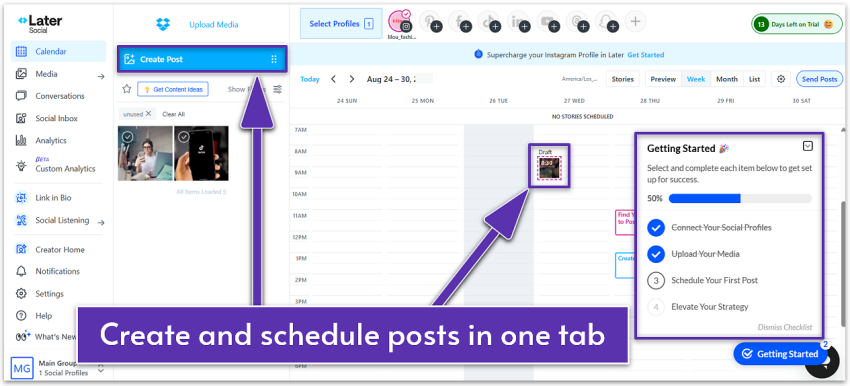
Later is not the best for bulk scheduling, given the limitations on the number of scheduled posts on the free (12 per profile) and entry-level plans (60 – 180 per profile). However, its Quick Scheduling tool speeds up posting by letting you drag and drop content into preset time slots. Instead of choosing times manually for each post, you can set a weekly schedule of your ideal posting times, and Later will automatically queue new content into those slots.
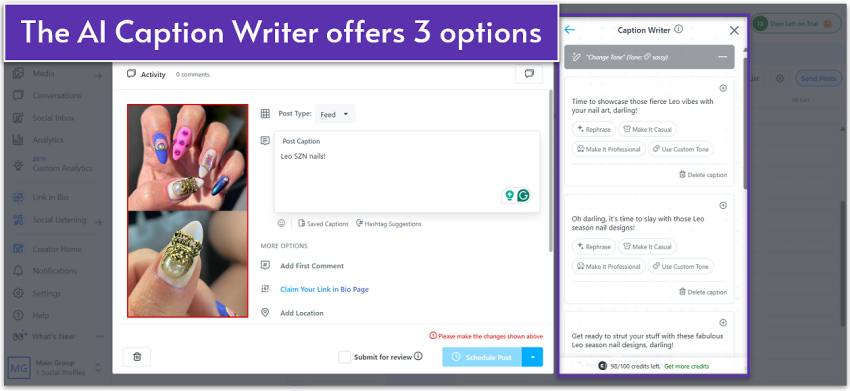
Later’s post editor lacks some advanced features, such as dedicated customization per network. That said, its general-purpose AI tools performed well in my tests, both for generating fresh content and repurposing existing posts.
Later also offers influencer marketing services and can recommend creators that align with your brand. You can also invite creators to collaborate directly through the platform. These services cost extra, but they save you time on research by connecting with vetted influencers. This type of marketing also helps you drive more targeted engagement and conversions for your campaigns.
Analytics and Reporting
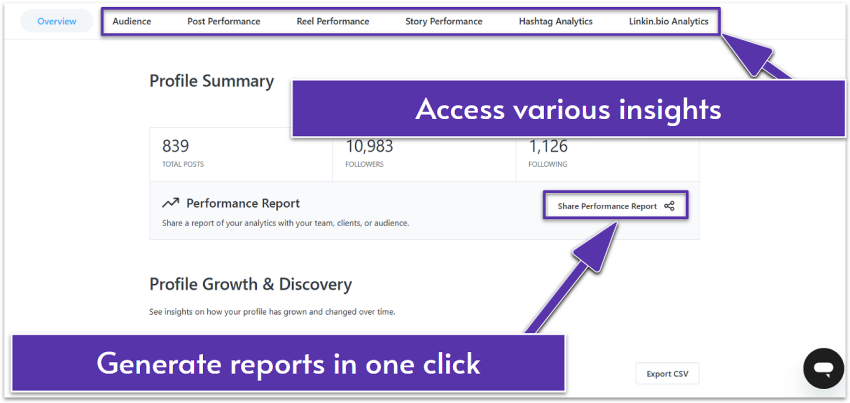
Later’s analytics are solid for a budget-friendly tool. This is particularly true for Instagram, with performance analytics available for posts, stories, reels, and even hashtags. Additionally, Later shows you insights about where your link in bio receives the most views. This could help you tailor campaigns more effectively by location. Still, its reports lack sentiment analysis, which would offer more context to support your content strategy than raw numbers alone.
Team Management & Engagement Features
Later offers standard team features, like assigning roles and permissions, and inviting people to collaborate on posts. However, advanced workflows or message assignments aren’t available. There’s a social inbox, but it’s limited to Facebook and Instagram direct messages, without the option to set auto responses.
While I’ve seen more comprehensive social listening tools among some alternatives, Later’s UGC tool is a huge bonus. It helps you build trust by showcasing real user experiences. You can search by hashtags, mentions, or tags to discover content your audience is creating about your brand, then request permission to reshare – all directly within the platform. Once approved, these posts can be saved to your media library and scheduled like any other content.
Later also offers a link-in-bio builder, even for free users, enabling you to create a custom landing page that drives traffic to multiple destinations, such as your shop, blog, or latest campaign.
Scalability & Pricing
Later is one of the very few social media management tools that offers a free plan, which covers one user, one social set (one profile per supported platform), 12 posts per profile per month, and a link-in-bio builder. However, its paid plans come with limits on the number of posts you can publish, which are relatively low compared to tools like SocialPilot that allow you to schedule 500 posts at once.
You can add more users and profile sets from the mid-tier plan and up. However, you can’t increase the number of scheduled posts per profile unless you subscribe to the highest-tier plan, which supports an unlimited number of posts. Overall, Later has more than enough to offer to Instagram-focused small businesses, creators, and freelancers, but it may be less suitable for larger teams.
Support
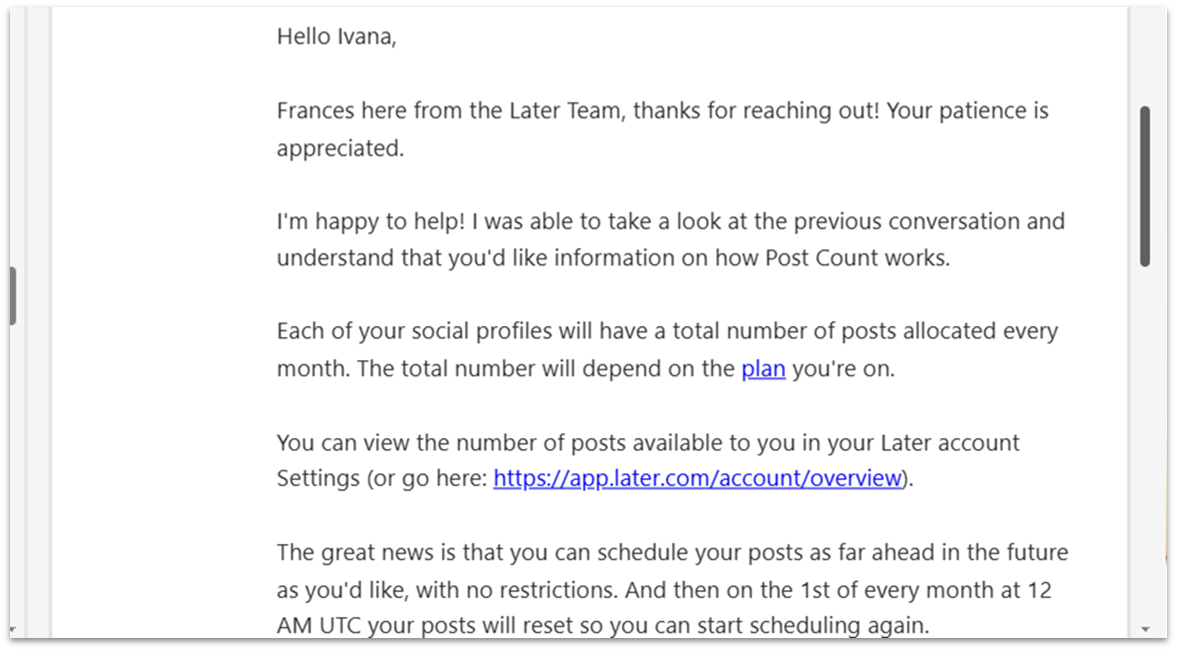
Support for free users is limited to the knowledge base, with ticket submissions allowed only during the first 30 days – a restriction that feels unfair. Paid users can submit tickets via chatbot or email, while the top-tier plan offers a 12-hour response time – not impressive, but still better than the usual 1–2 business days.
In my test, I received a reply to a low-priority query within one business day, with the agent providing clear explanations, resource links, and practical examples. That said, I would’ve valued real-time help when troubleshooting issues with connecting a business account.
#6 Canva – Best for Design-First Creators and DIY Brands
Ease of Use
Chances are, you’ve used Canva before for design. Its social media scheduler is just as intuitive and beginner-friendly. Setting up social posts was a breeze thanks to the drag-and-drop editor and hundreds of ready-made templates.
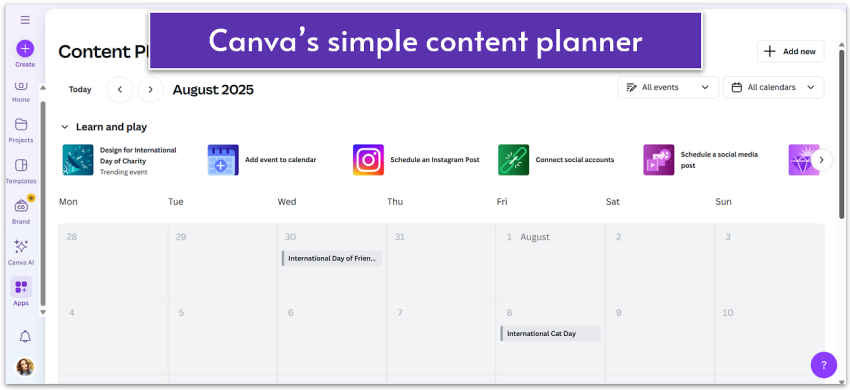
Scheduling, Content Planning, and Publishing
Canva’s scheduling tools aren’t as advanced as some dedicated social media platforms, such as SocialPilot, Sprout Social, and Hootsuite. But it’s more than enough if you’re not looking for fancy features. You can’t schedule posts to multiple platforms at once or schedule posts in bulk. The number of posts you can schedule per month is limited to 100 posts across all platforms combined.
I often manage my socials on the go, with frequent interruptions (like standing in line at the bank), so I appreciate that Canva lets you pause and edit a post without re-uploading the file and starting all over again. The Magic Switch™ feature also stood out as a real time saver, letting me quickly reformat content for different platforms without editing from scratch.
The abundance of content creation and repurposing tools, coupled with millions of design assets, provides ample creative freedom to build engaging social campaigns without leaving the platform.
Analytics and Reporting
In my tests, Canva proved to be the weakest option for analytics, offering only basic metrics, such as impressions, reach, likes, comments, and saves, for posts. It lacks advanced reporting, social listening, and benchmarking, so if you rely on in-depth insights to shape your strategy, a dedicated tool like SocialPilot, Sprout Social, or eClincher will serve you better.
That said, if analytics aren’t your top priority, Canva’s content planning tools, coupled with its design capabilities, still make it a convenient all-in-one option.
Team Management & Engagement Features
Canva supports basic team features like inviting people to collaborate and assigning them roles and tasks. You can share your content calendar, edit and comment on designs and posts. However, Canva lacks social engagement tools, such as a unified inbox, so it may not be the right tool for those managing a large volume of messages through social media.
Scalability & Pricing
Canva’s social scheduler is available as part of its paid plans, which also include access to powerhouse design features, high-quality media assets, and templates. Canvas is one of the most affordable tools on my list, even for teams, with flexible pricing allowing you to pay as you grow.
While not built for large agencies requiring advanced social media workflows and analytics, you might want to give Canva a go if you’re an influencer, content creator, or small business with a content-first approach.
Support
Canva offers a very comprehensive knowledge base filled with articles and tutorials. There’s also a chatbot for basic queries and design advice. But verify important information, because the AI can make mistakes. As a paid user, you’ll get access to live (limited to “certain issues”) and 24/7 ticket support. While live chat wasn’t available, I tested its ticket system. I was pleased by the fast response time and the representative’s knowledge and attentiveness.
#7 Hootsuite – Best for Data-Driven Marketing Teams
Ease of Use
Setting up an account and connecting social profiles on Hootsuite was simple, but the interface initially felt overwhelming due to its extensive features. Compared to simpler platforms like Buffer or Later, Hootsuite comes with a moderate learning curve. Yet, Hootsuite reviews suggest it strikes an outstanding balance between depth and usability.
Scheduling, Content Planning, and Publishing
Hootsuite’s drag-and-drop calendar and bulk upload options make content planning faster, but I was disappointed to find that bulk scheduling (capped at 350 posts) isn’t available on the entry plan. Still, it’s not unusual for platforms to restrict this feature – SocialPilot does the same. Unlike Later and eClincher, Hootsuite only includes its link-in-bio builder on higher-tier plans.
Hootsuite offers one of the most advanced link tools I’ve seen among social media management platforms. You can create custom URLs, shorten and track links (automatically and manually), natively or through integrations like Bitly.
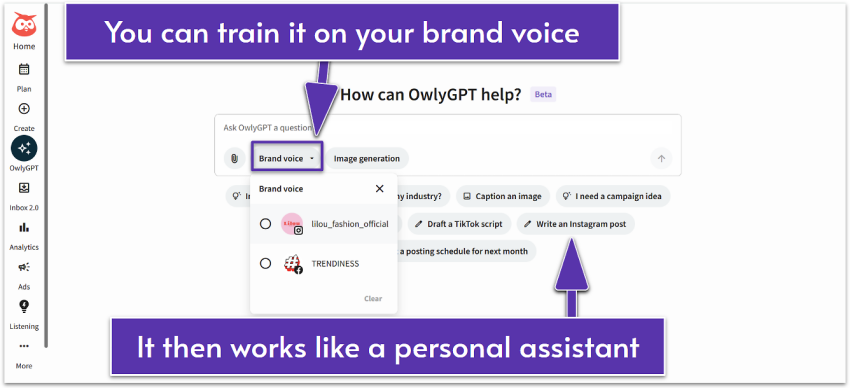
I was impressed by Hootsuite’s AI-powered assistant, OwlyGPT. Unlike general-purpose chatbots, Hootsuite’s OwlyGPT uses real-time social conversations to generate insights, strategies, and content that align with your brand. While many social media tools offer some form of AI assistance, OwlyGPT learns from your brand’s style guide, turning into a personal social media assistant that can research, strategize, and produce brand-consistent content.
Its AI also excels in repurposing top-performing posts. It helps you quickly identify what works best and recreate it in seconds, keeping your content calendar full and engaging.
Analytics and Reporting
In my tests, Hootsuite stood out as one of the strongest platforms for in-depth analytics and reporting. To give you an idea of its depth: while most tools simply suggest the best time to post by network, Hootsuite goes further by recommending the best time based on your specific goal, whether that’s boosting engagement, building awareness, extending reach, or driving traffic.
You can monitor performance by post, profile, and network, and view all your analytics across channels in a single tab. I especially appreciated how Hootsuite compares paid vs. organic results, which makes it much easier to measure ROI, see which content delivers the best value, and adjust your budget with confidence.
Combined with its social listening and benchmarking tools, Hootsuite provides a 360-degree view of brand health, audience sentiment, and competitor performance, giving you the insights to refine campaigns with data-driven precision.
While Hootsuite offers hundreds of metrics, some are more useful for companies and brands than for individual creators. That’s why I recommend it primarily for businesses and agencies that need advanced reporting, rather than solo users.
Team Management & Engagement Features
Hootsuite covers all the team collaboration essentials, with the Enterprise plan also offering team productivity insights. While I found similar collaboration workflows at cheaper tools like Buffer, few can match Hootsuite’s unified social inbox. Features like saved and suggested replies, automated Instagram DMs, message routing and tagging, and internal notes help manage engagement efficiently.
Furthermore, Hootsuite provides real-time inbox monitoring and team performance analytics, enabling you to track resolved conversations, response times, customer satisfaction, and other key metrics.
Scalability & Pricing
Hootsuite no longer has a free plan and starts at a higher price point than many competitors. That said, its entry plan is packed with advanced capabilities, justifying the higher cost. Features like a unified inbox, brand and competitor sentiment tracking, and benchmarking – often reserved for higher tiers elsewhere – are included from the start.
Overall, it’s among the best social media management tools for agencies, businesses, and brands ready to invest in a mature, feature-rich platform.
Support
Hootsuite’s support is available Monday through Friday via live chat, a ticket system, and even on X and Facebook – a rare perk among social media management tools. I reached out via the live chat window in my dashboard and got an instant reply, though I often had to go back and forth for clarification. On the plus side, Hootsuite’s comprehensive knowledge base is well-structured and covers most common troubleshooting needs.
#8 Buffer – Best for Solo Creators and Lean Small Businesses
Ease of Use
Unlike many social media management tools that have a lengthy sign-in process and require credit card details, I was able to create my Buffer account and access the dashboard within seconds. Buffer’s interface is clean, modern, and easy to navigate, even for first-time users.
Scheduling, Content Planning, and Publishing
Buffer offers excellent scheduling tools, including the ability to schedule unlimited posts, Instagram stories, and first comments. Buffer reviews suggest that users appreciate the one-click scheduling options, such as “Share Next,” “Share Now,” “Next Available,” and “Prioritize.” I find its bulk scheduling option (up to 100 posts) solid, given the affordable price, although it’s far less than what similar tools typically offer (350 posts).
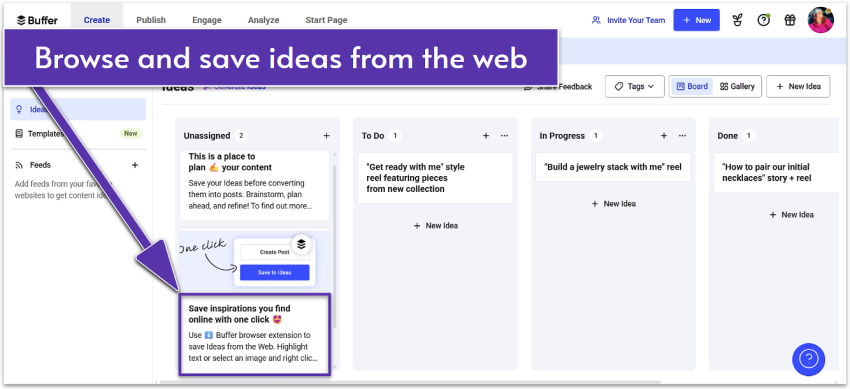
What impressed me the most was Buffer’s content planning tools. Its “Ideas” feature is like a lightweight work management tool. It lets you capture content ideas, organize them into boards, like “To Do” and “In Progress.” You can find direct access to media integrations, like Canva, Dropbox, and Google Drive, tag teammates, and attach notes within these boards. You can also access unlimited AI to create, repurpose, and refine content.
Analytics and Reporting
Buffer’s analytics and reports are more limited compared to tools like Sprout Social and Hootsuite, both in depth and in the number of supported channels. It only covers Instagram, Facebook, X, and LinkedIn.
On Buffer’s free plan, you get very basic post engagement analytics restricted to 30 days, which is too short to spot meaningful trends. Paid plans unlock engagement insights, best posting times, and audience demographics, but, similar to Later, the reports lack the actionable context needed to refine your content strategy.
Another drawback is that Buffer doesn’t consolidate analytics into a single dashboard. Instead, you can view each channel separately, making it more challenging to get a comprehensive view of your social performance.
Team Management & Engagement Features
Buffer includes standard collaboration features, like assigning roles and permissions, sharing drafts for approval, and adding internal notes to content. However, engagement features are limited to responding to comments on Instagram and Facebook, which could be a significant drawback if your team needs to manage conversations across multiple platforms or relies heavily on community interaction as part of its social strategy.
Scalability & Pricing
Buffer is among the most affordable social media management tools, with a free plan that includes one user, three social channels, and 10 posts per channel. Paid plans are billed per channel within each tier, with discounts available for those managing 10 or more channels. If you purchase multiple Buffer plans, you can consolidate all channels and users to a single account.
Each Buffer plan includes the Start Page (its link-in-bio builder), but it counts as one of your channels. Since plans cover only one channel, you’ll essentially need a separate plan to use it. A workaround might be using the free plan to access this feature. Due to some limitations outlined above, I find Buffer to be best suited for those just starting or managing a modest social presence.
Support
Buffer provides support via email and its Discord community during standard business hours. Unlike Later, which limits free users to self-service only, Buffer gives you access to human support on every plan. I reached out through my dashboard and received a response via email the same day. It’s worth mentioning that its chatbot handles simple questions quite well. If you prefer to troubleshoot independently, the extensive help center has you covered.
The Best Social Media Management Tool
The “right” tool depends on your team size, the number of channels you manage, the balance between analytics and fast publishing, and whether clients require approvals. Pricing also varies significantly – some charge per seat, others per channel, and many gate features (such as AI, listening, and reporting) are available on higher tiers. Do the math for your real setup, not the headline price.
If you want quick direction, our top picks are:
- SocialPilot for most small teams and agencies that want strong features at a fair price
- Sprout Social for larger teams that need deeper analytics, listening, and advanced collaboration
If you’re short on time and need to decide quickly, make sure you:
- List your nonnegotiables (inbox, bulk scheduling, approvals, reporting)
- Run a live trial with an actual campaign
- Stress-test handoffs if you work with teammates or clients
Of course, preference matters. The best tool is the one you’ll use every day. If you need more help in making your decision, check out our in-depth reviews.
FAQ
What are the most popular social media management tools?
What are the best free social media management tools?
What are the best social media management tools for small businesses?
Is Hootsuite worth it?


So happy you liked it!