
Your website may look great to you, but how it performs for visitors depends entirely on factors such as their location, device, and connection speed. That’s why Ian Pham, Product Manager at GTmetrix, recommends using their tools to test your site’s performance under multiple scenarios. We spoke about the different factors that should be tested along with recommended fixes and why it is smart to continuously monitor your site even after it has been fully optimized.
This interview was originally published on May 11, 2020.
What is GTmetrix?
GTmetrix is a web performance testing tool that gives you insights into how well your site loads and provides actionable recommendations for how to optimize it. With seven global test regions, over 20 mobile devices and variants, and multiple connection speeds and Analysis Options, you can test your site and optimize it for any scenario.
Along with monitoring and alerts, you can track performance trends and be notified when your site underperforms based on the criteria you define.
What key performance indicators does GTmetrix analyze?
Currently, GTmetrix uses modified versions of Google’s PageSpeed and Yahoo’s YSlow libraries to assess if your website adheres to best practices for web performance. We also give you essential timings like Fully Loaded Time, First Contentful Paint (the time it takes for the first piece of content to be rendered in your browser), Time to First Byte, and more.
In an upcoming release, we’re excited to bring Google Lighthouse reports into the GTmetrix testing platform to provide a wealth of new performance insights.
Can GTmetrix compare a site’s loading speed on multiple browsers, locations, devices, or resolutions?
Absolutely. We offer testing in 7 global test regions, on a real hardware Android device, and on eight different connection speeds from Fast Broadband to 56K. You can do this all with a Basic account – which is free! PRO users have access to additional mobile devices, screen resolutions, and more monitoring frequency and capacity.
Testing multiple user scenarios is one of the key things we recommend to every website owner to see how fast their website performs. We often have customers with decent performance on Desktops; however, when they check their mobile performance, it’s a different story entirely!
Is there a way to run GTmetrix with and without ads to see how they impact loading speed?
GTmetrix offers the ability to block ads by enabling Adblock Plus. When activated, GTmetrix uses the EasyList filter list – one of the most popular ad-blocking lists – to filter out most if not all advertisements, marketing widgets, and/or tracker code on your page. The difference is often shocking.
What is the difference between PageSpeed and YSlow?
The primary difference is that they are authored by different companies, Google and Yahoo, according to their perspectives on how to build an optimized website. Therefore, each has its own set of recommendations and weights that contribute to their final score.
We have modified and updated both rule sets to be more up to date with modern web standards, including responsive design and HTTP/2 consideration. More information is available on our website.
When GTmetrix returns speed scores, are there recommendations for improving the aspects that are performing poorly?
We offer several guides and how-to articles on how to fix your low scoring recommendations. On the GTmetrix report page, you can expand any low scoring recommendation with a click to display the requests that triggered the recommendation.
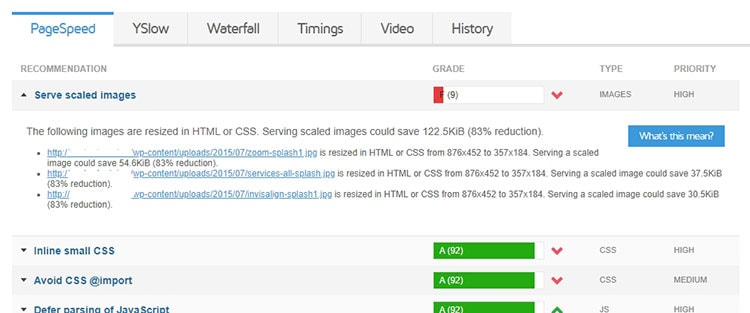
You can then click on “What’s this mean” to get more information on the recommendation, including how it affects your performance and how to fix it.
Can GTmetrix run comparisons of several URLs?
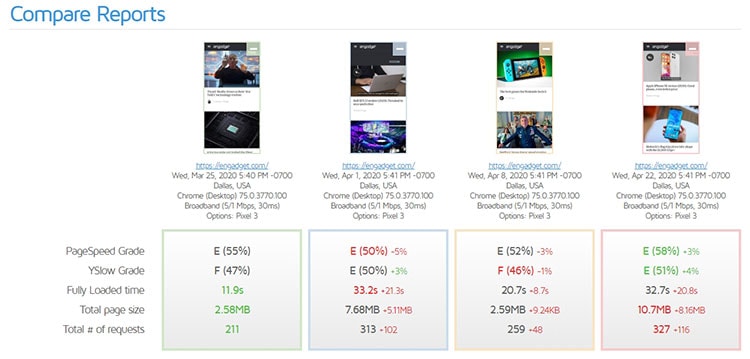
You can compare up to 4 different GTmetrix reports by either running a new comparison analysis on a URL or comparing a GTmetrix report.
Are users able to track and monitor speed performance over time?
Absolutely – It’s critical to monitor your website for performance. The internet is complex, and your website is composed of many moving parts – any one of those elements which can change unexpectedly, and with it, your page load time. That’s why we recommend ongoing monitoring with GTmetrix.
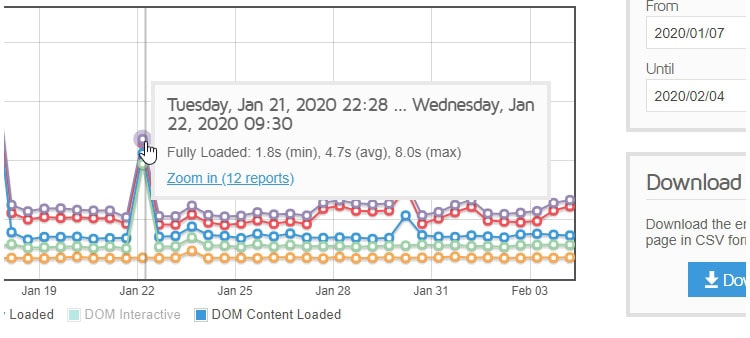
Once your page is monitored, you can track and visualize your page performance with our History charts:
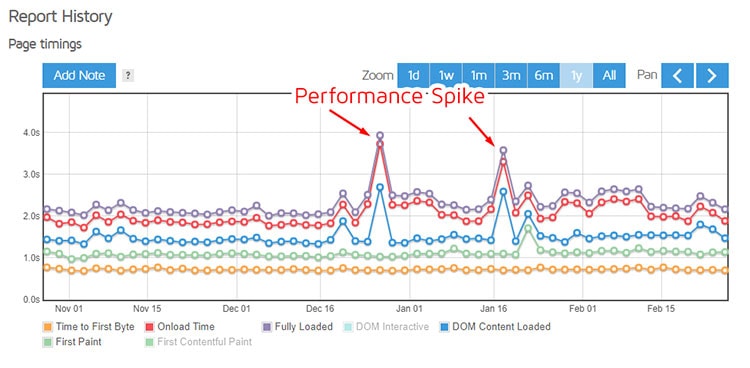
Reports in close proximity are aggregated and hovering over the History node gives you Minimum, Maximum, and Average Fully loaded times within those reports.
What’s great is that you can start monitoring your page daily, weekly, or monthly on our free account. PRO users have access to hourly frequencies and remote region monitoring.
What advanced analysis options are available in your Developer Toolkit?
The Developer Toolkit offers advanced features to get even more insights from your GTmetrix tests, including:
- Simulating performance on over 20 different mobile devices and variants
- Portrait and landscape options also available
- Screen resolution changes from 320×480 up to 1920×1200
- Device Pixel Ratio customization also available
- Custom User-Agent override
- Great for debugging
- Custom connection speeds
- Essential if you’re looking to optimize for visitors on a specific connection speed
- DNS Override
- Great for development/staging sites, analysis for before/after server migration, etc.
- Analysis Presets
- Test with your own set of Analysis Options with one click
You offer the ability to video record page loads. How is that advantageous?
Video playback allows you to actually see what your visitor experiences while your page is loading.
Key timings like First Contentful Paint are a lot more relatable when you can see what was rendered, and experience how long it took.

GTmetrix’s video player also allows you to slow down playback up to 4x to visually assess any loading issues, as well as jump to major page load timings.
Combined with Monitored Alerts, you can capture how your page loaded when an alert is triggered for even more debugging insights (only available to PRO users).
You can also generate a filmstrip of the video if you need a more static visualization for assessment.

What support services are available?
We offer GTmetrix PRO users product support and advice on how to best utilize GTmetrix as well as setting up monitored reports in bulk and other technical requests. Also, if pages aren’t analyzing properly, we provide preliminary assessments as to why that may be.
While we don’t offer optimization services, we do have partners that can help optimize WordPress, Shopify, Magento, and other popular platforms, as well as guides and how-tos for DIYers.
What’s next for GTmetrix?
We are currently working hard to integrate Google Lighthouse data into GTmetrix testing! This is a long-time coming, and we’re excited to bring these industry established metrics into our reports. Of course, we’ll be applying the GTmetrix take on things so that users can get Lighthouse metrics with our spin on guidance, easy-to-approach technical explanations, and enhanced visualizations.
There will be some slight changes to the above features as a result but look for a newly improved GTmetrix in the months to come.