Inside this Article
Quick Google Analytics GlossaryHow to Set Up Google AnalyticsQuestions You Can Ask Google AnalyticsCustom Settings to Get the Most from Google AnalyticsReviewing Google Analytics ReportsUsing the Google Analytics 4 DashboardComparisonsAcquisitionEngagement > EventsMonetizationInsights ShortcutsRetentionGoing Beyond the BasicsGoogle Analytics 4 UpdatesIn Conclusion
We’ll also show you the most important updates from the release of Google Analytics 4 in October 2020 – a massive update to Google Analytics’ dashboard, core features, and overall usefulness.
Quick Google Analytics Glossary
Before we dive into the benefits of Google Analytics, here is a quick glossary of terms used throughout the interface and in this post. Users – Users and Active Users show how many website visitors or app users initiated at least one session on your website or app during a selected date range. Reports – Google Analytics offers over 50 free reports and the ability to create custom reports to help you analyze demographics and behavioral data about your website and/or app users. Sessions – Sessions show the period of time a user is actively engaged with your website or app during a selected date range. Traffic Sources – This shows how users discover your website or app through organic search, paid search, referral websites, and direct traffic channels. Direct Traffic – Direct Traffic is when a user starts a session on your website without coming from a trackable traffic source, such as someone typing your URL into their browser instead of clicking on your website link from Google search results. Campaigns – Campaigns track specific ways users discover your website or app. Google Analytics tracks campaigns created by Google AdWords Ad Campaigns and custom campaigns you create to track specific groups of traffic sources. Pageviews – The total number of pages visited on your website or app during a selected date range. Pages / Session – The average number of pages visited per session during a selected date range, including repeated views of a single page. Engagement – Any time a user interacts with your website with the most basic actions, like clicking links or scrolling down on a page. Bounce Rate – The percentage of sessions during a selected date range where a user visited one page on your website or app and exited without interacting with any elements on the page. Audiences – Custom groups of users which you create to help identify specific types of users in Google Analytics reports, remarketing efforts, Google AdWords ad campaigns, and other Google webmaster tools. Funnels – The path users take to complete a goal on your website (like signing up for your newsletter). Conversions & Goals – Conversions represent the number of times users of your website or app complete a defined action or objectives. Goals measure the specific objectives that you define as valuable for your business, such as a purchase from your online store or submission of a quote request form. *Note: Goals has been removed from Google Analytics 4 and integrated into the ‘Events’ tracking and reporting features.* The following features and concepts have either been introduced for the first time on Google Analytics 4 or made much more prominent. Events – Any time someone makes a specific interaction with your website – such as filling in a form, watching a video, making a purchase. You can see how engaging your site is and how effective certain features are. Events replaced Goals in Google Analytics 4. Demographics – Demographics are various data points about the makeup of your users that helps you understand how specific groups of people interact with your websites. Demographics can be broken down into gender, age, location, interests, and much more. Acquisition – How people are landing on your website and your most significant sources of traffic. Acquisition data shows how you perform in search engines, paid ads, social media, and specific marketing campaigns. Lifetime value – Under the Acquisition tab in Google Analytics 4, Lifetime value measures the monetary value of users’ interactions with your website from their first visit. The displayed in your reports is an average value estimate collected from all users. There’s no need to memorize all of these. If you get stuck in Google Analytics, you can hover over most terms to see a pop-up description box. There are also some crucial terms you need to understand, relating to data privacy and Google Analytics. GDPR and CCPA – Two laws passed to protect internet privacy and regulate how companies track, store, and utilize data online. The European Union implemented the General Data Protection (GDPR) in 2018. The California Consumer Privacy Act (CCPA) was also signed into law by the US state in 2018. Cookies – Small packets of data that track your activity on websites. Cookies are used for many different purposes but have gained much attention due to their use in online advertising. Due to increased privacy concerns, Google Analytics 4 is moving towards a ‘cookie-less’ model and focusing on AI-driven analytics.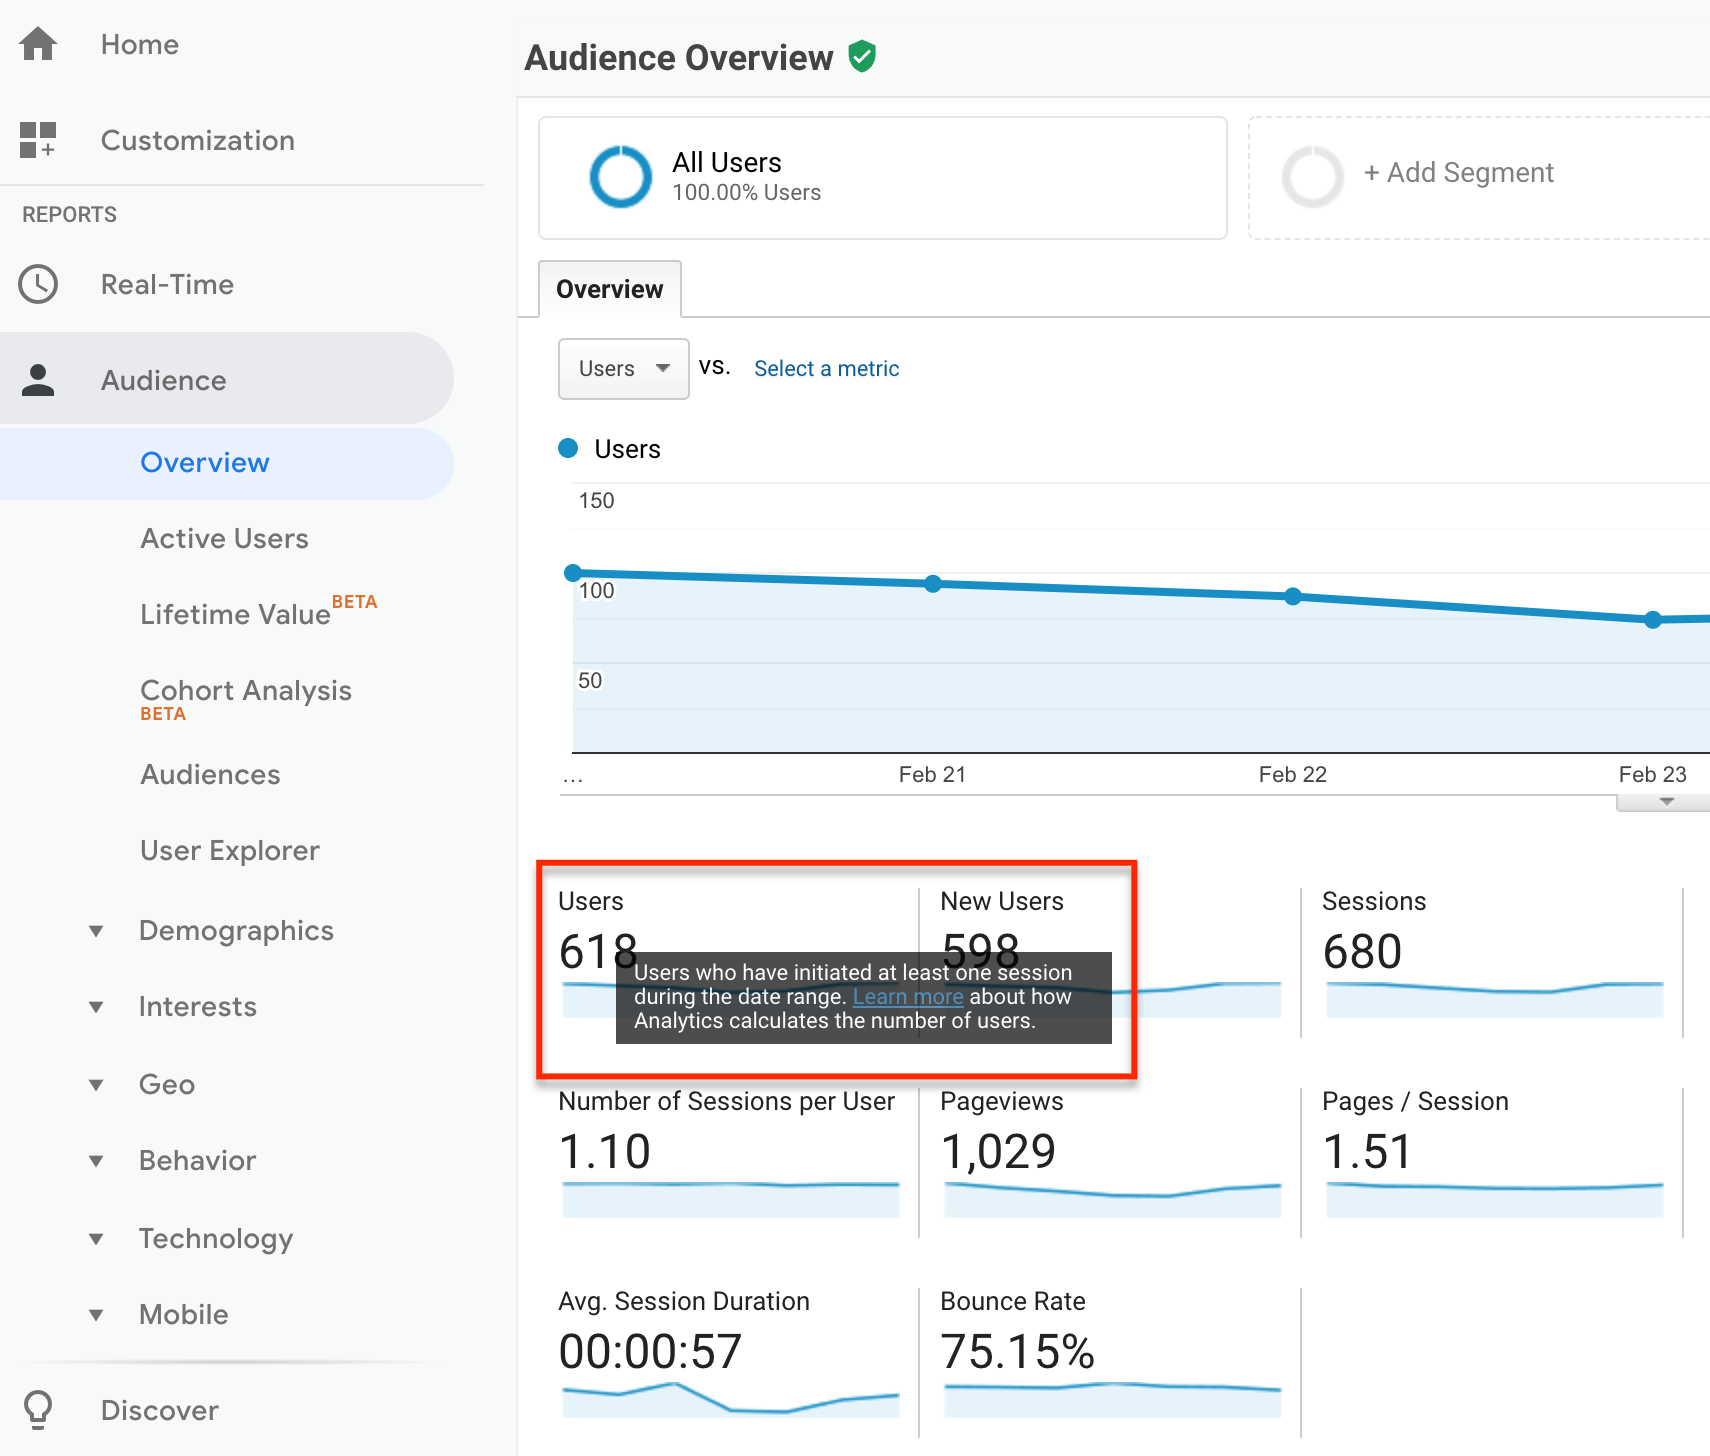 You can also click on the question mark at the top right of any Google Analytics screen to access Google Analytics Help Center and search for specific terms and help information.
How to Set Up Google Analytics
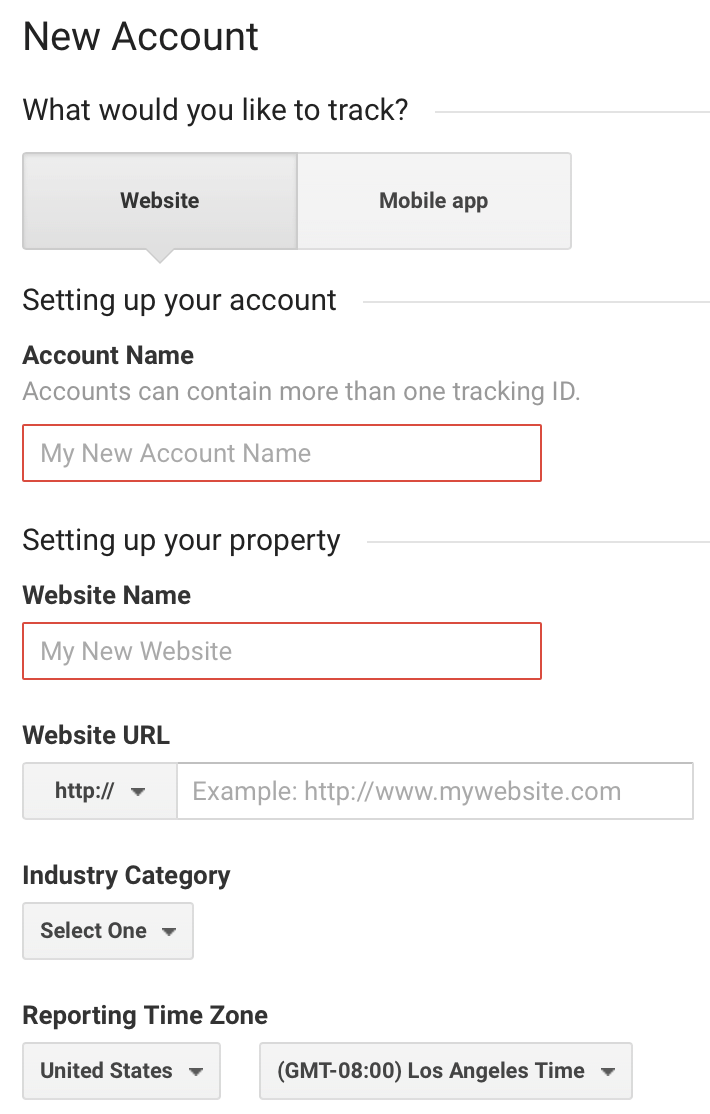
To use Google Analytics, you will need to log in with your existing Google Account or create a new one. If you use Google AdWords, Gmail, Google Docs, Youtube, or any other Google product for your business, you should use the same account for Google Analytics. Once logged in to your Google Account, you will sign up for Google Analytics.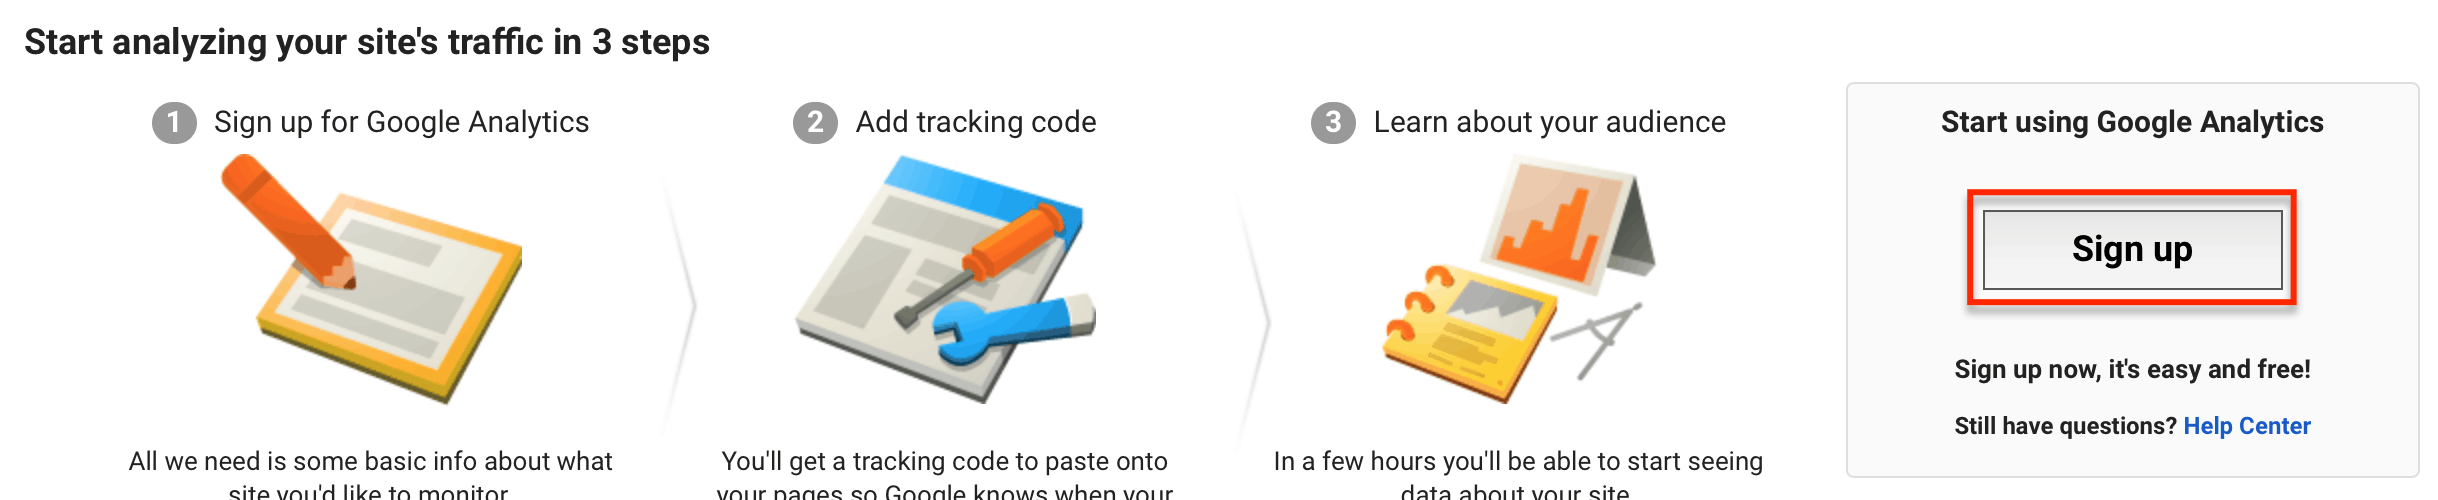 To create your Google Analytics account, enter your website or app details.
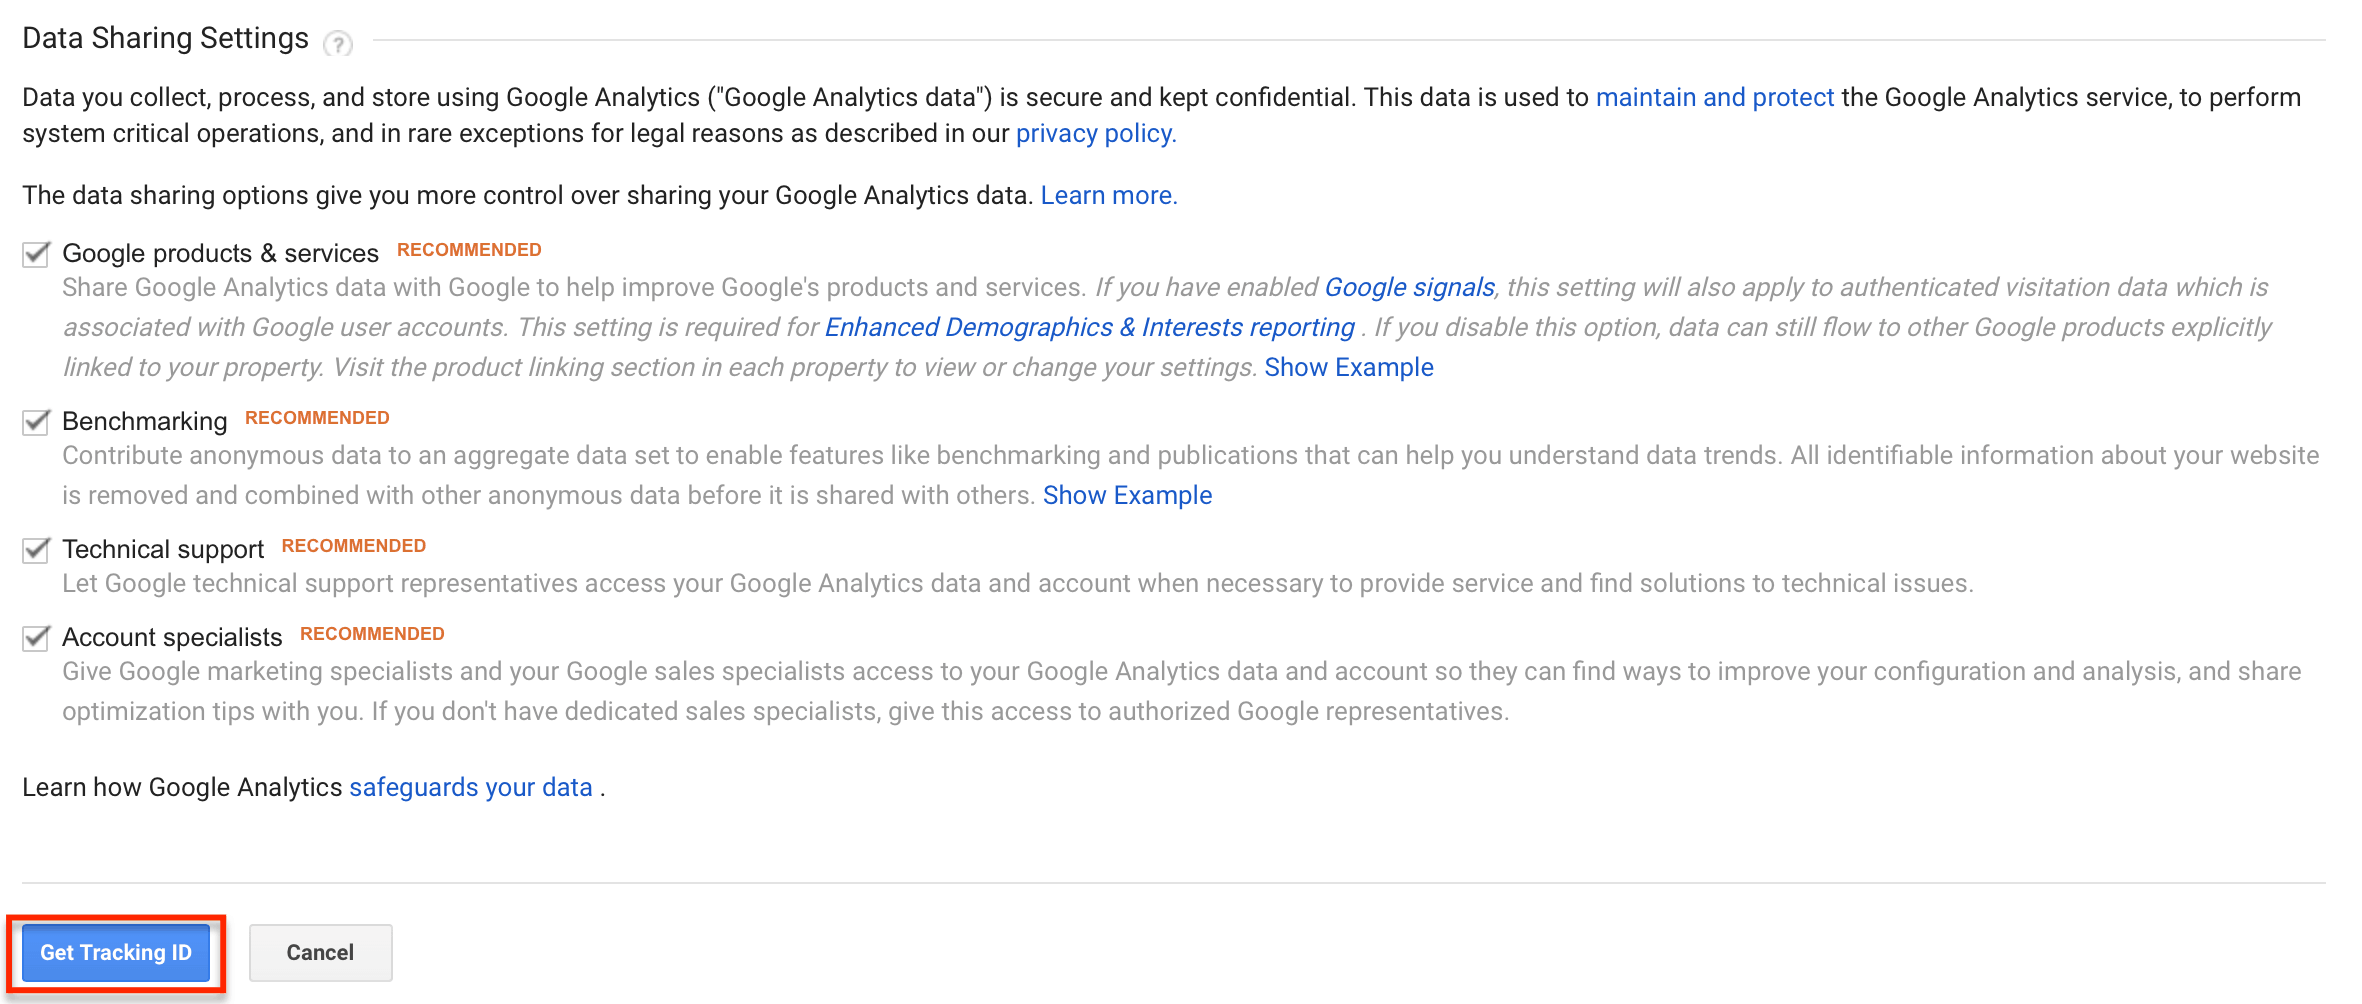
 Confirm data sharing settings between Google Analytics and other Google business products and click Get Tracking ID to finish creating your free Google Analytics account.
 Your Google Analytics Tracking ID is a unique identifying number and code for your website or app.
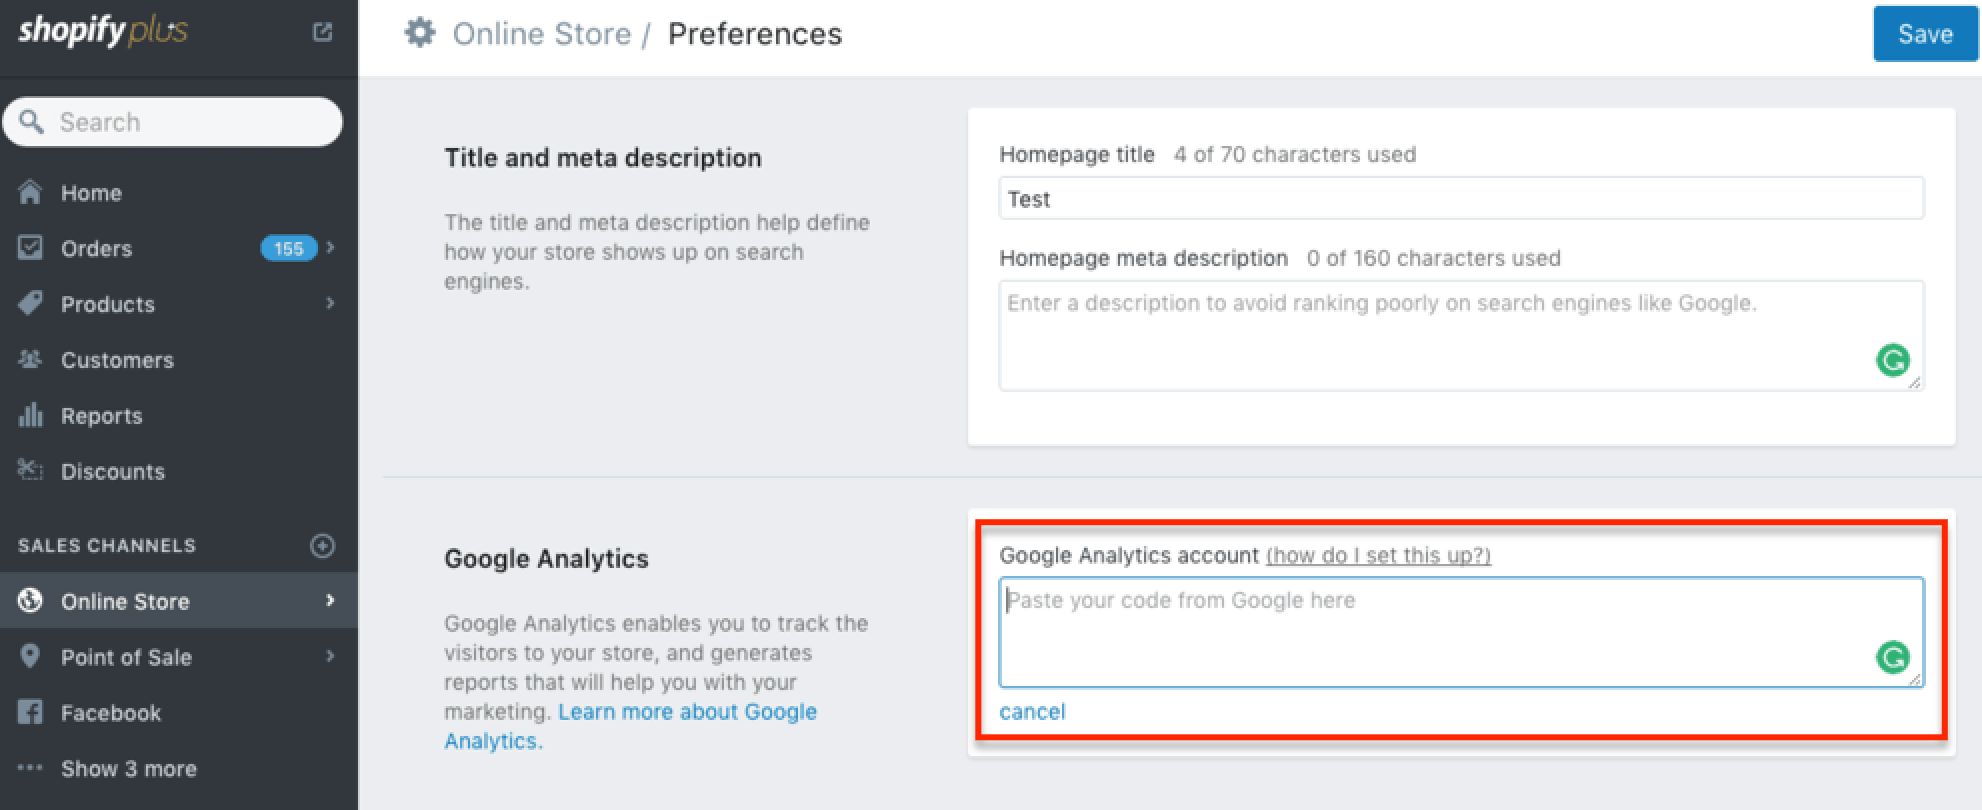
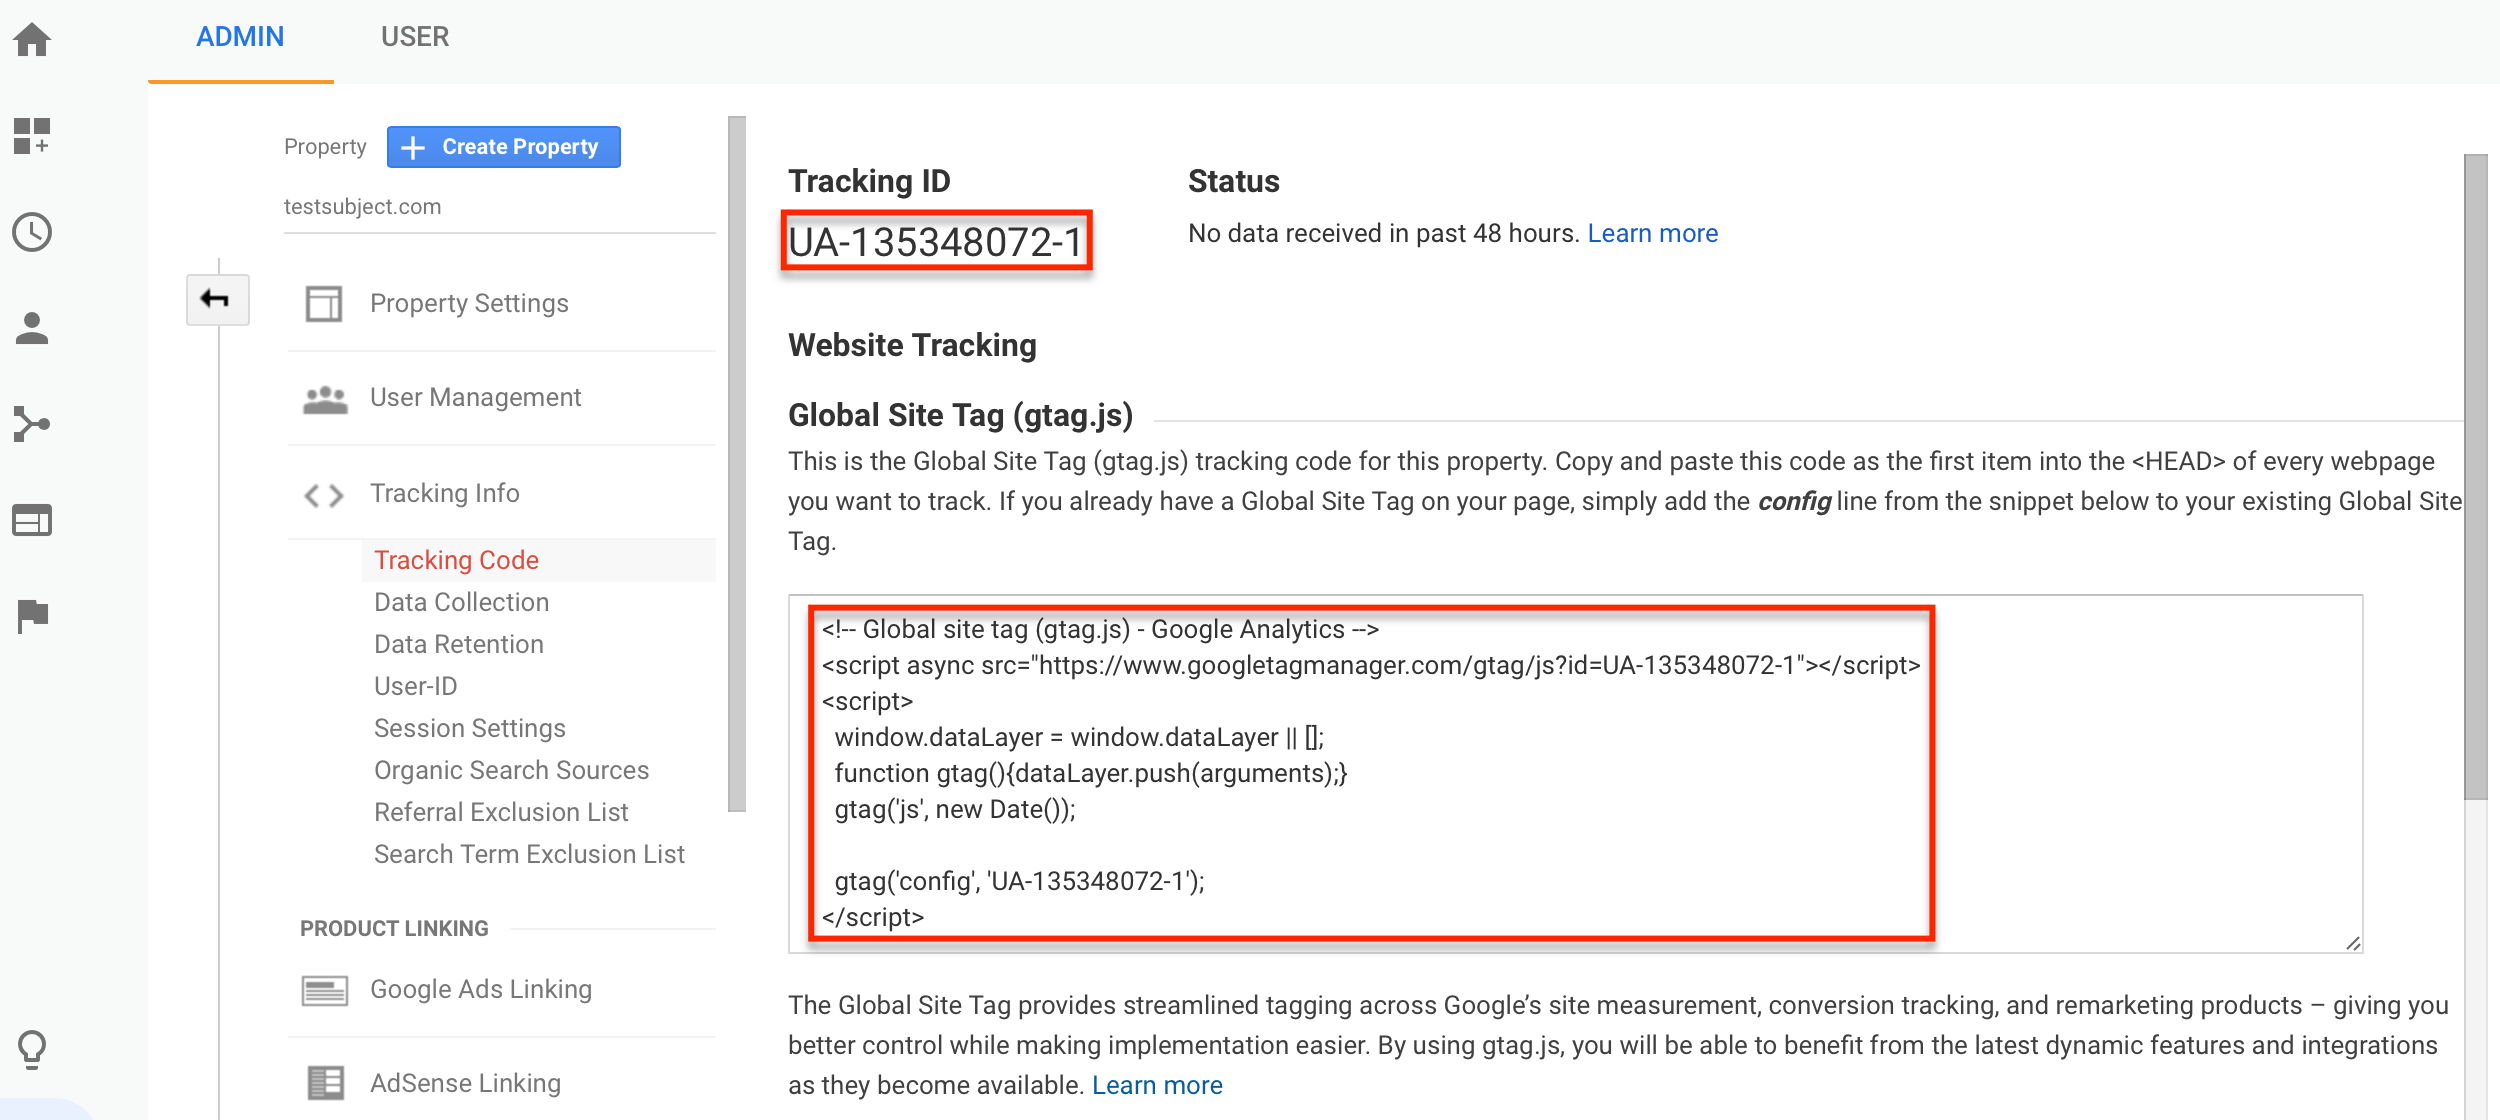 Popular app makers, website builders like Wix, content management systems like WordPress, and ecommerce platforms like Shopify have specific directions on how to add Google Analytics tracking code to your website or app.
Look in your website’s administrative dashboard to find directions on how to start tracking your website or app users with Google Analytics.
Popular app makers, website builders like Wix, content management systems like WordPress, and ecommerce platforms like Shopify have specific directions on how to add Google Analytics tracking code to your website or app.
Look in your website’s administrative dashboard to find directions on how to start tracking your website or app users with Google Analytics.
Questions You Can Ask Google Analytics
Using the search box at the top of the Google Analytics interface, you can ask the following questions about your website or app users.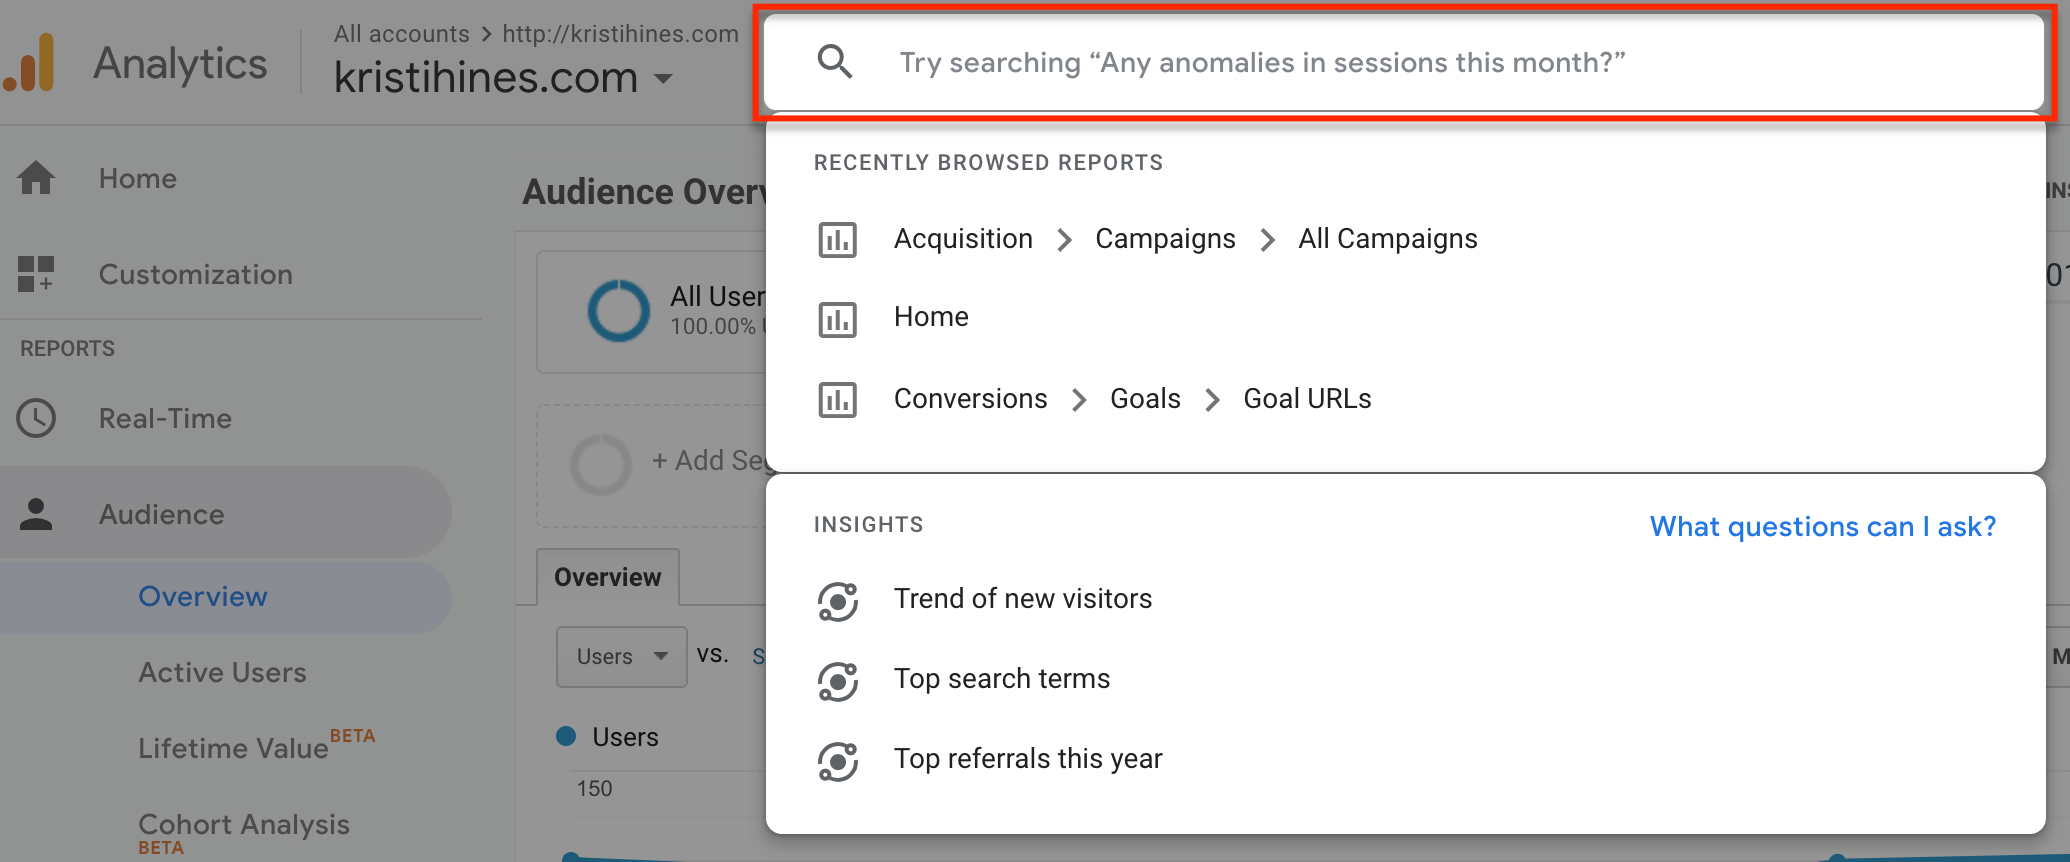
- How many users did I have this week/month/quarter/year?
- Show me a breakdown of users by device type/location/age.
- What are my top pages in terms of pageviews?
- What are my landing pages in terms of sessions?
- How long do users stay on my site/use my app?
- New vs. Returning Visitors last month?
- What countries do my users come from?
- What are my top cities in the US in terms of users?
- What’s my goal conversion rate?
- What’s my average page load time?
Custom Settings to Get the Most from Google Analytics
While you wait for Google Analytics to start collecting data from your website or app, you can configure the following settings in your Admin interface to get the most out of your reports. Access the Admin interface from the left sidebar menu.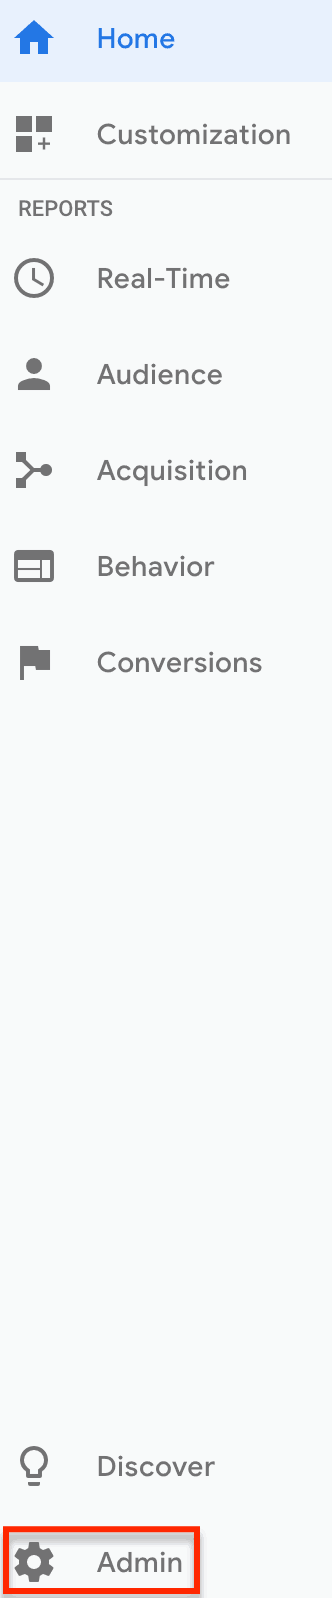
Goals
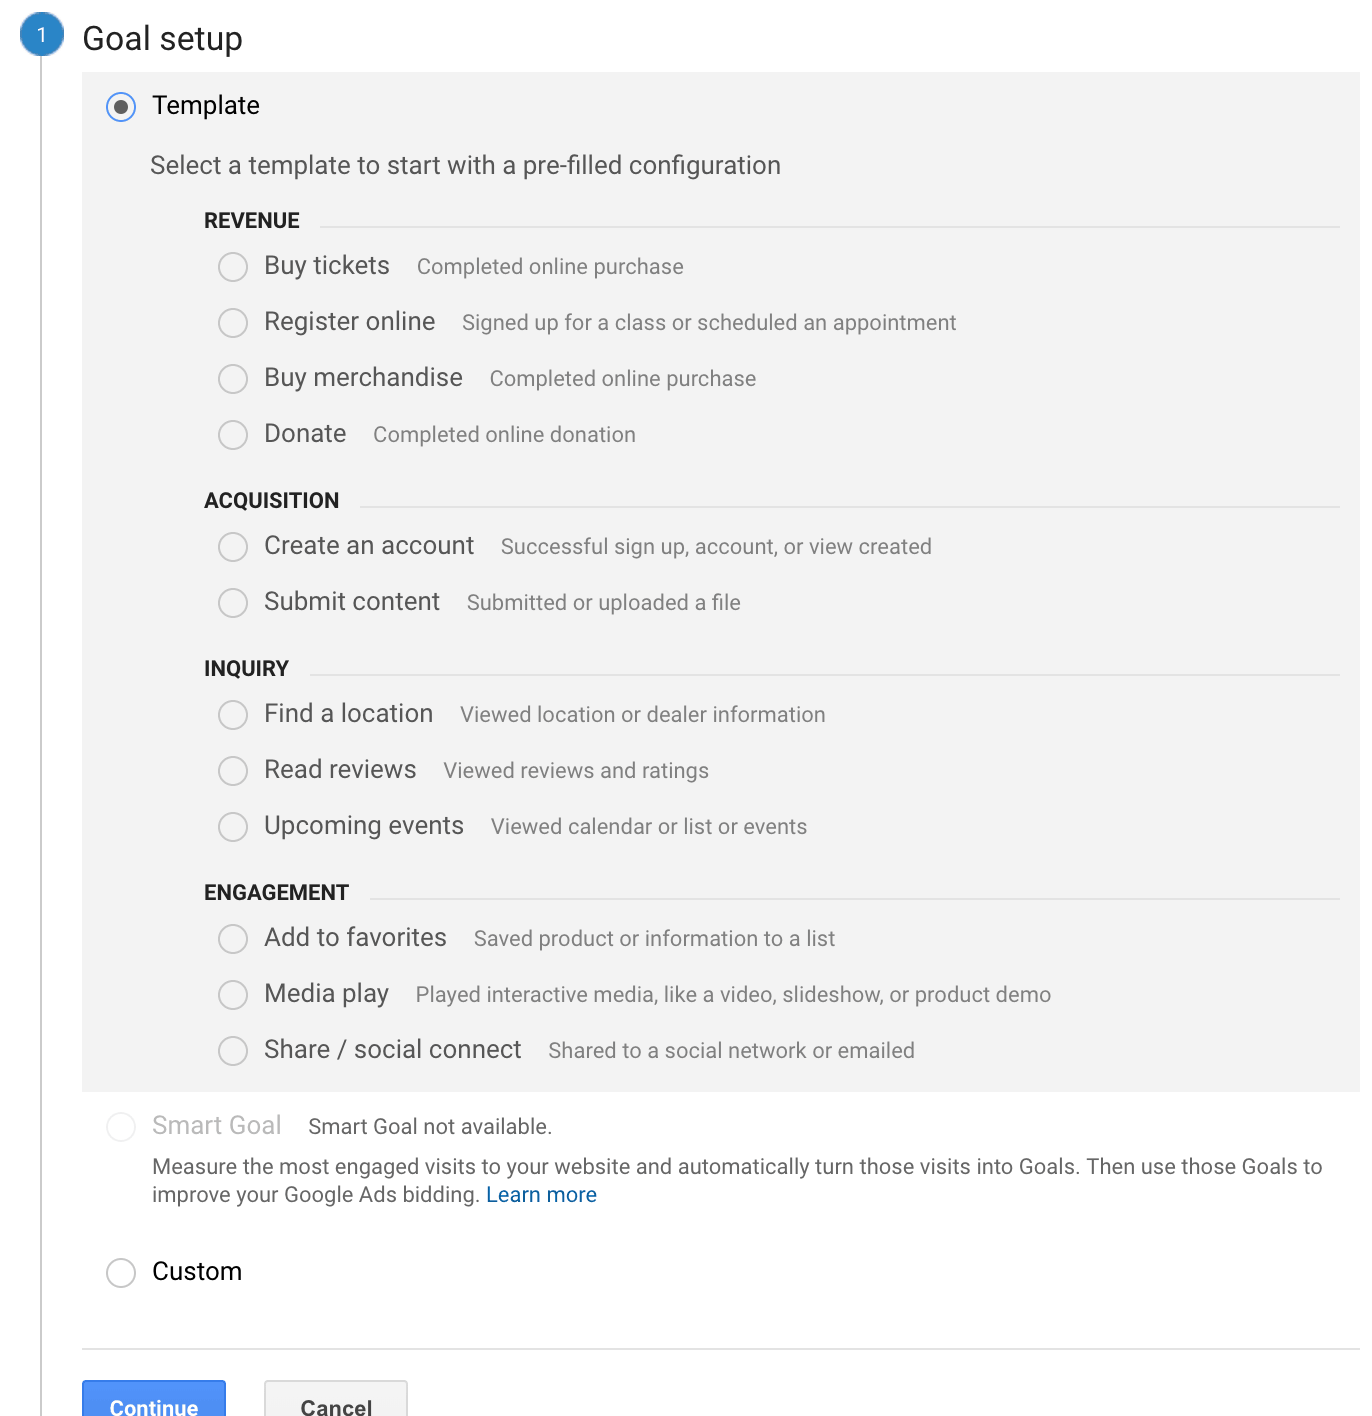
Conversion reports in Google Analytics can reveal the most profitable users on your website or app. To use them, you will need to define one or more Goals for your website or app users to complete, such as completing a purchase through your website shopping cart or making an in-app purchase.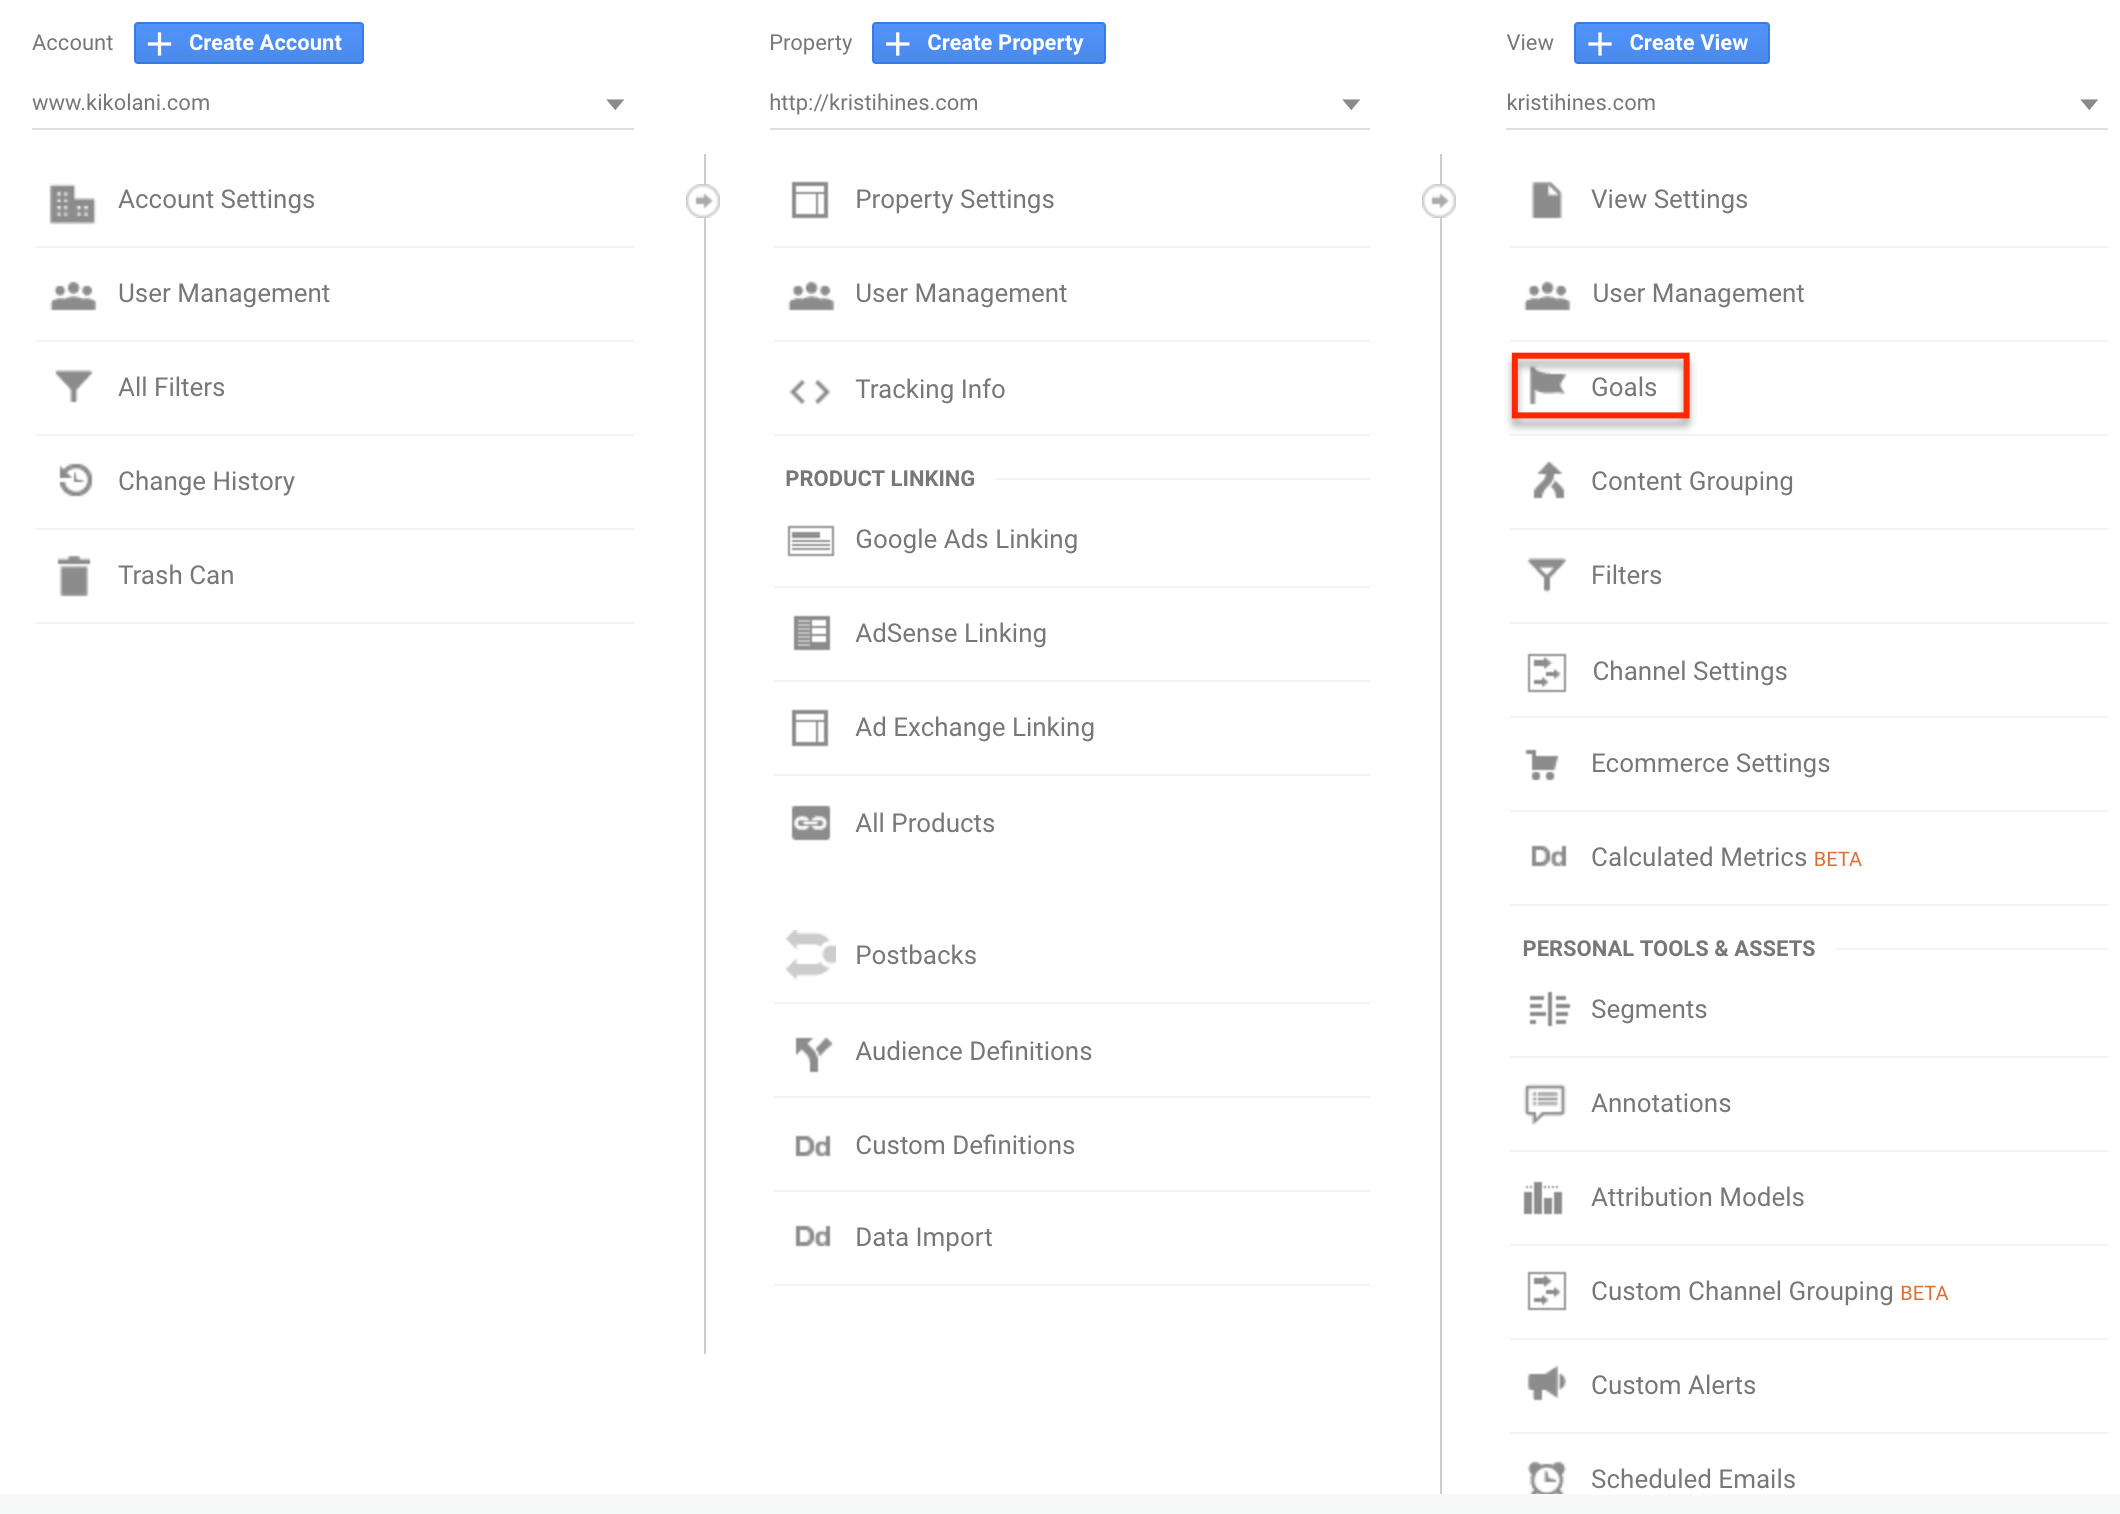 Google Analytics offers templates for you to choose from when creating a new Goal. Choose the one that best fits the objective you want users to complete on your website or app.
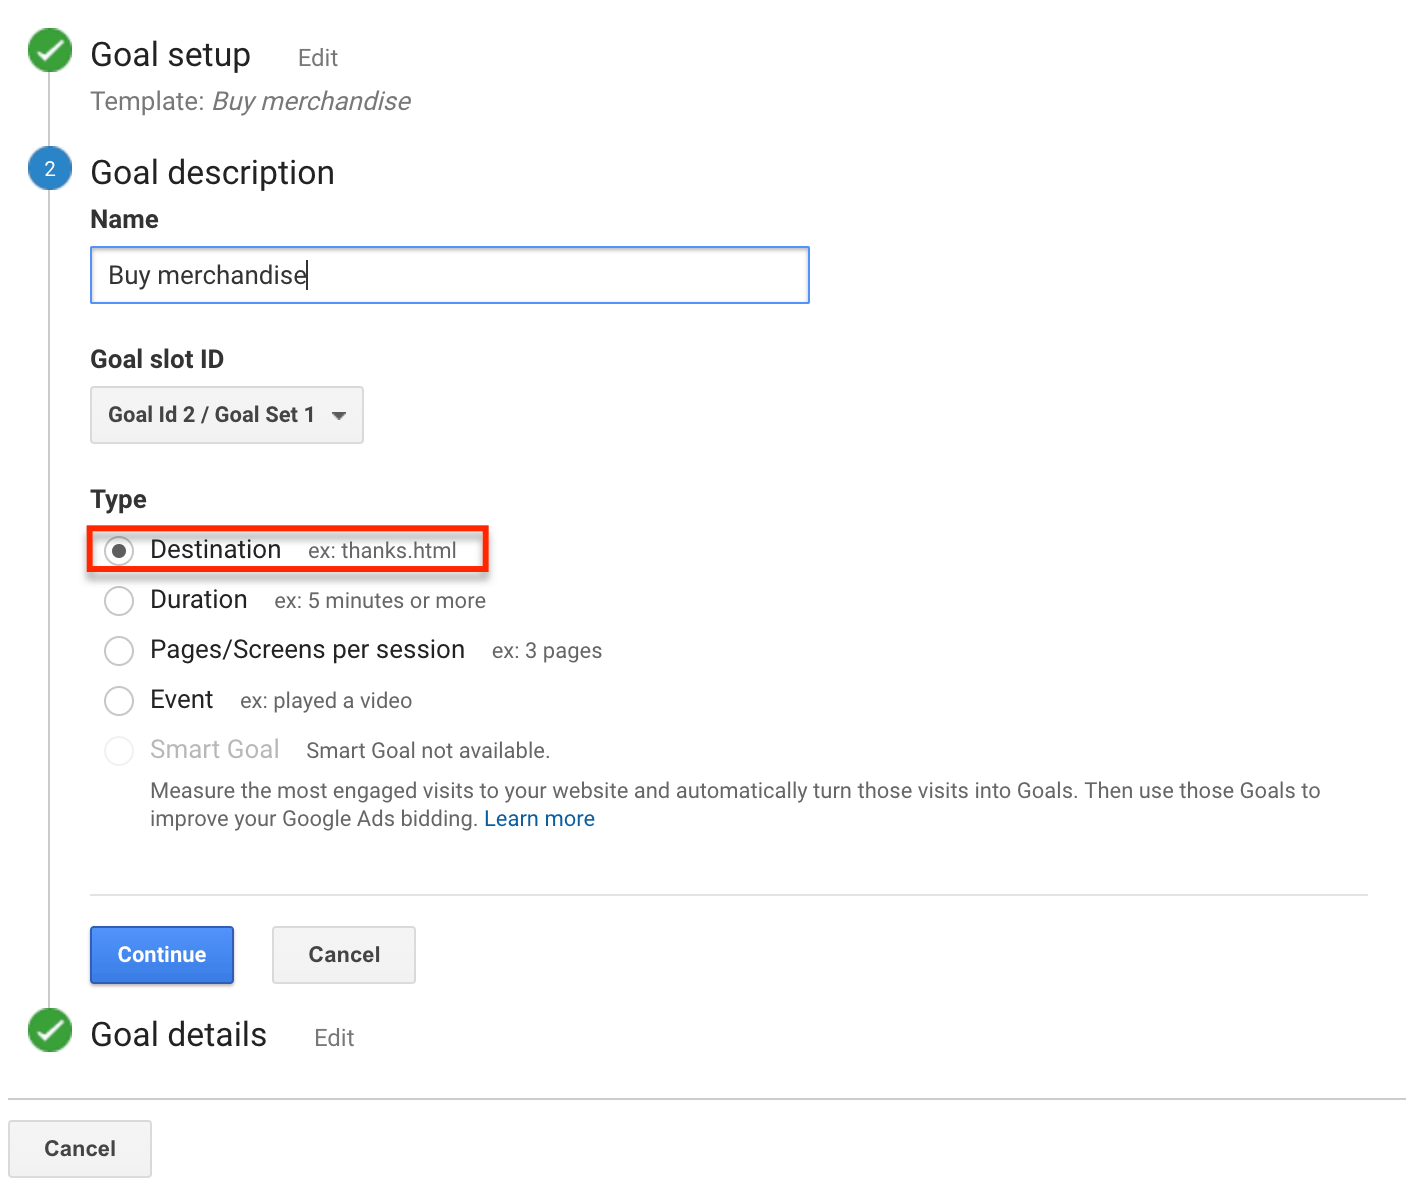
 Once you have chosen a template, you will be directed to the appropriate goal type. If you have an ecommerce store and select Buy merchandise, it will choose the Destination goal type.
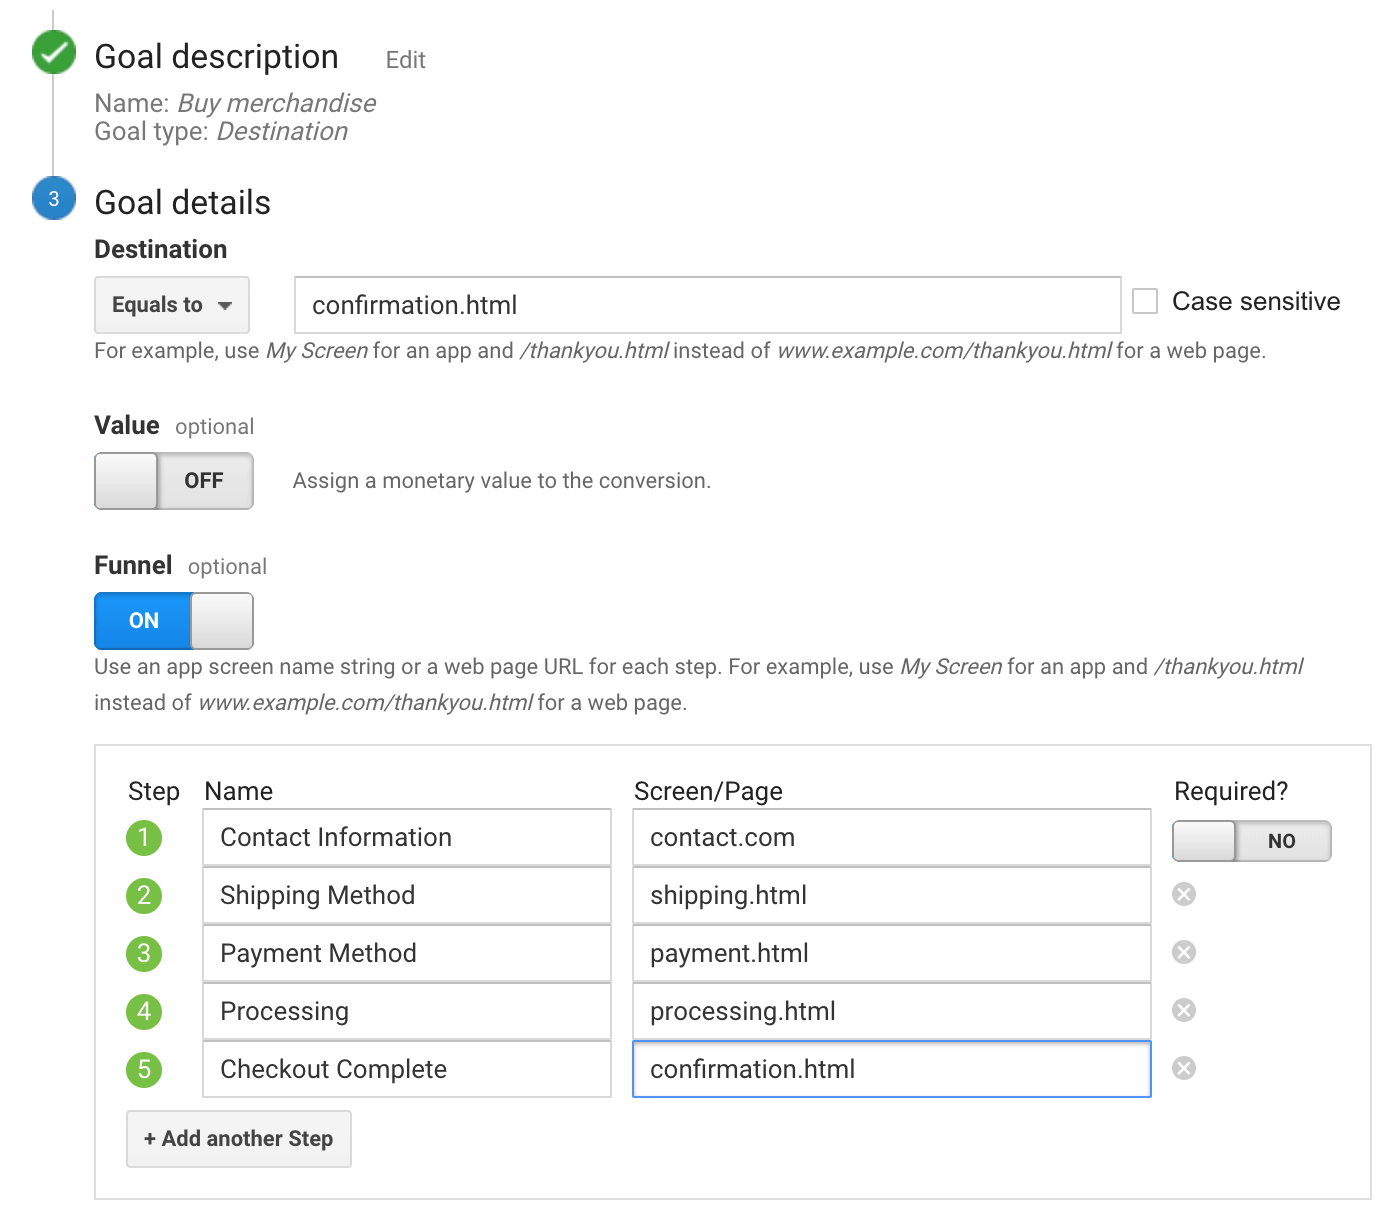
 From here, you will continue to Goal details and create a funnel to track the path of your users who begin to make purchases. The funnel will track the percentage of users who start the process but don’t finish using the steps and pages you specify.
 Continue to create Goals as needed to track additional tasks you want users to take on your website or app. You can create up to 20 Goals for your website or app.
Ecommerce
Ecommerce website owners can toggle this option under View Settings to track transaction and product data from third-party shopping carts, mobile devices, and other internet connected points of sale.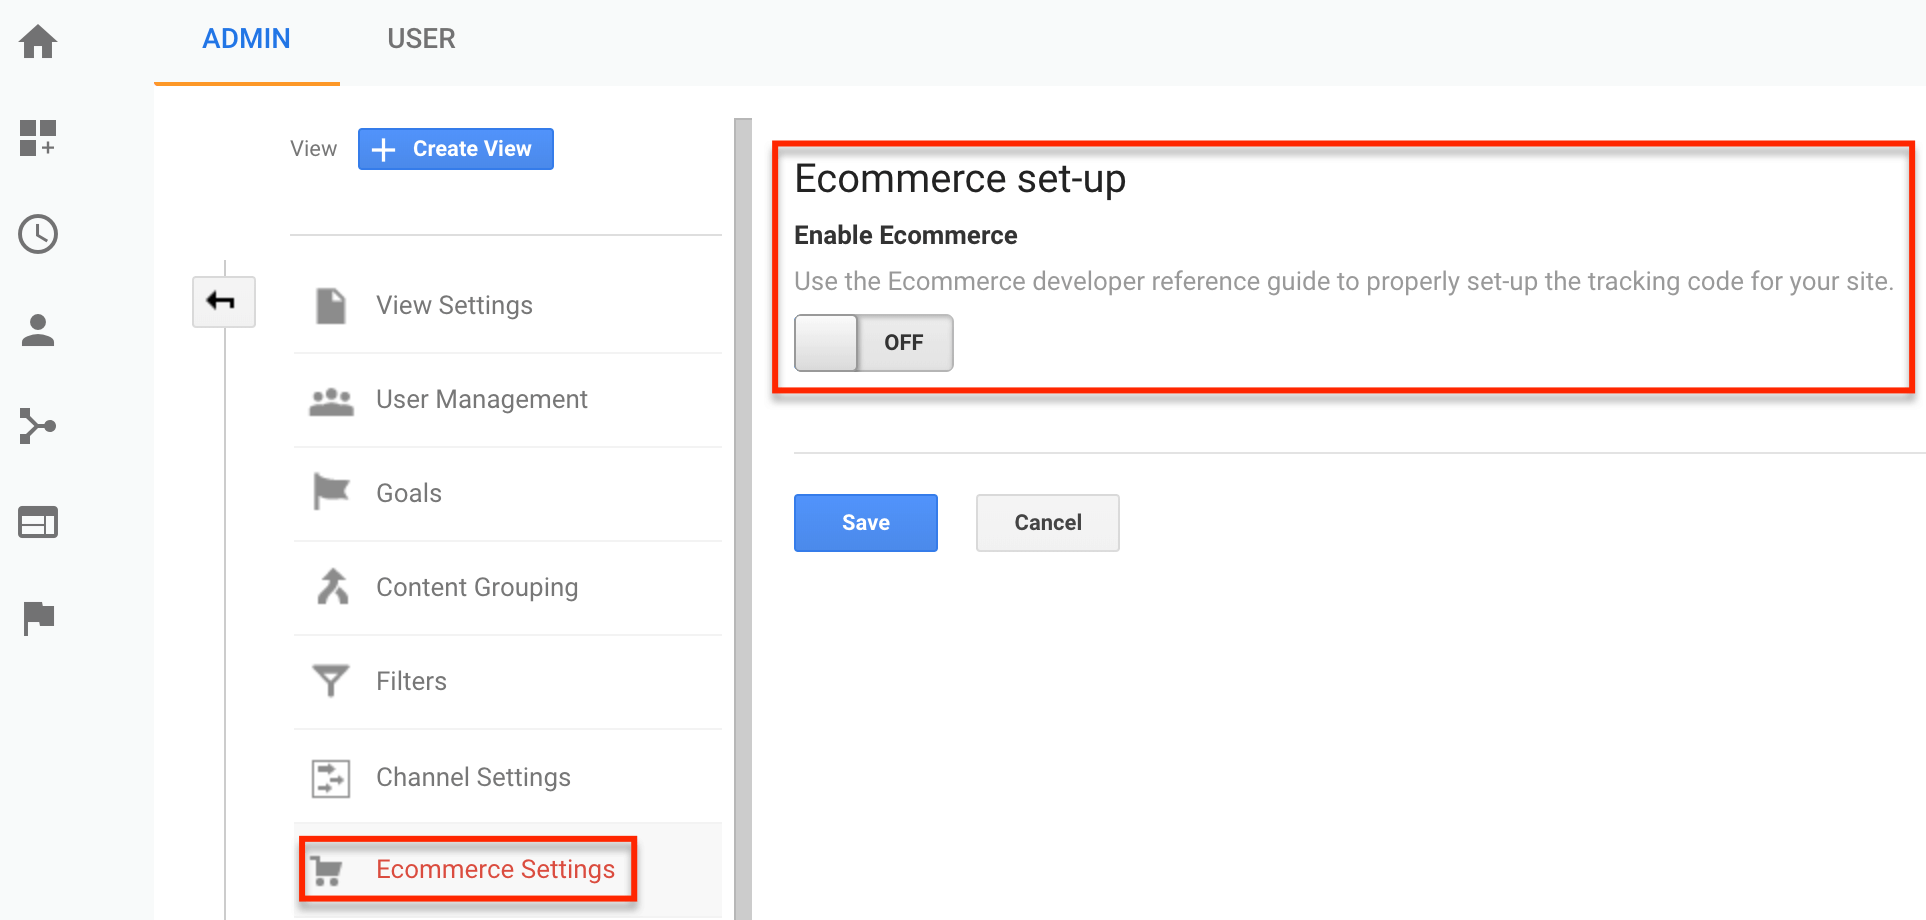 If you use a popular ecommerce platform like Shopify, you can refer to its documentation about how to send sales data and visitor behavior from its service to Google Analytics. This will allow you to view all of your website data in one application, instead of trying to match your Google Analytics data with your ecommerce platform’s data.
Audience Definitions
Audiences in Google Analytics represent the users most likely to complete conversion goals on your website or app. You can track specific groups of users to your website or app by adding new audiences under Audience Definitions.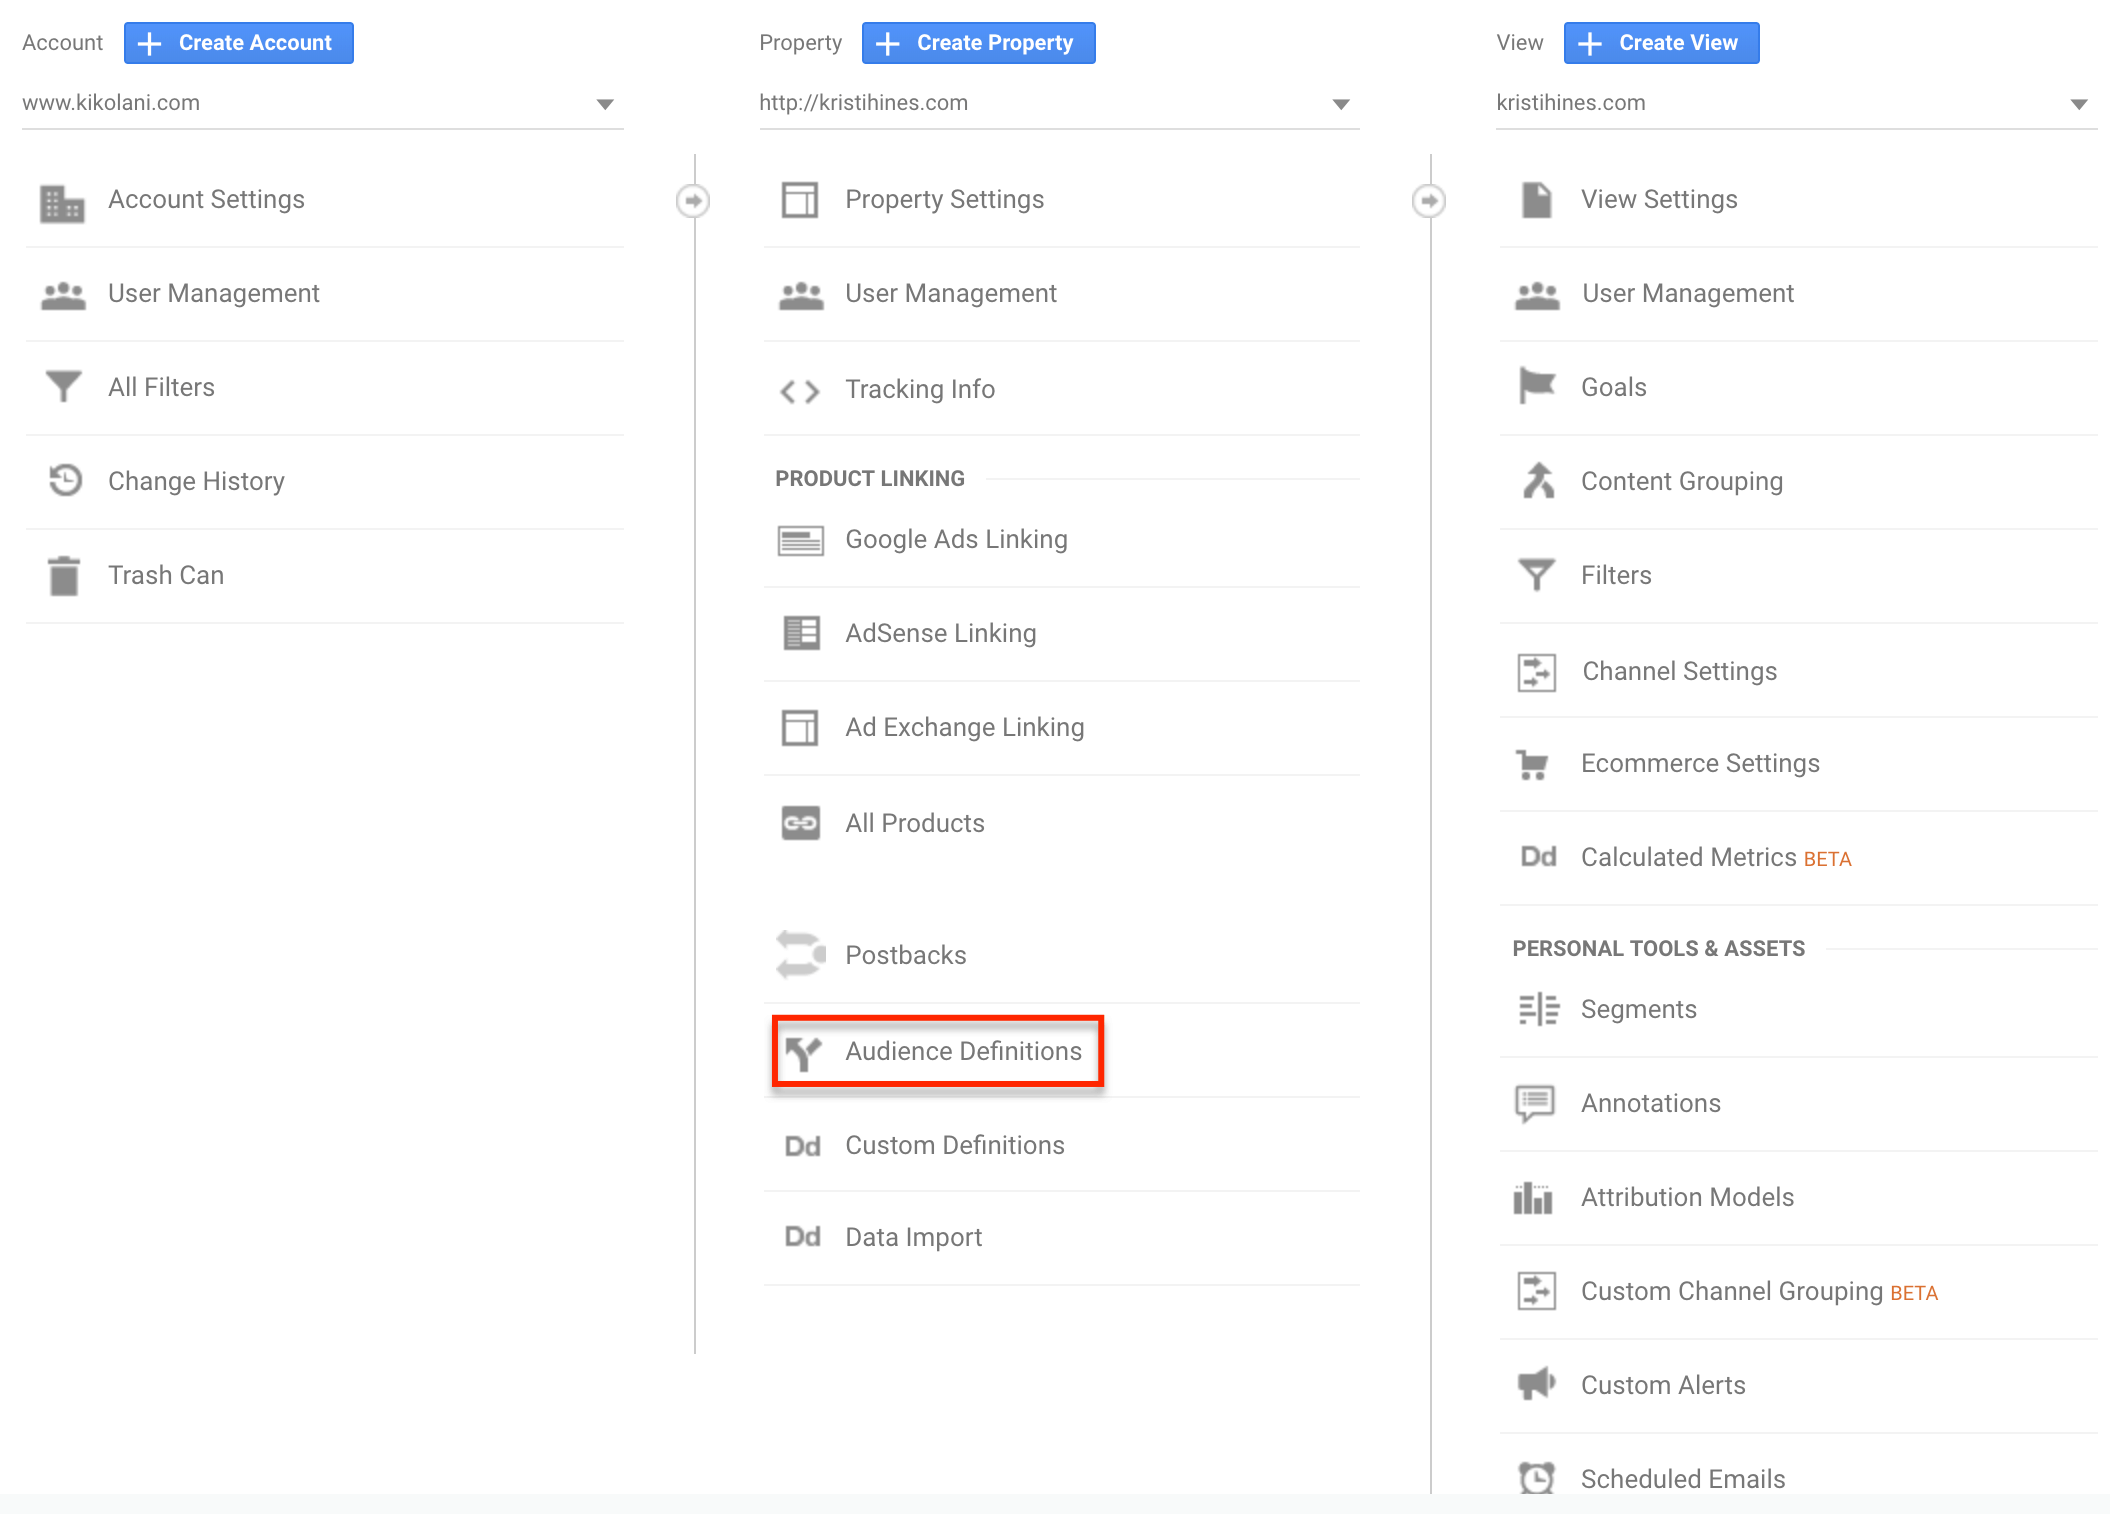 These Audiences can be used in conjunction with Google AdWords for remarketing advertising. Let’s say you look at face care products online, and a few hours later, those same products appeared on your favorite cooking site. That’s remarketing with Google AdWords, as explained when you click on the AdChoices link.
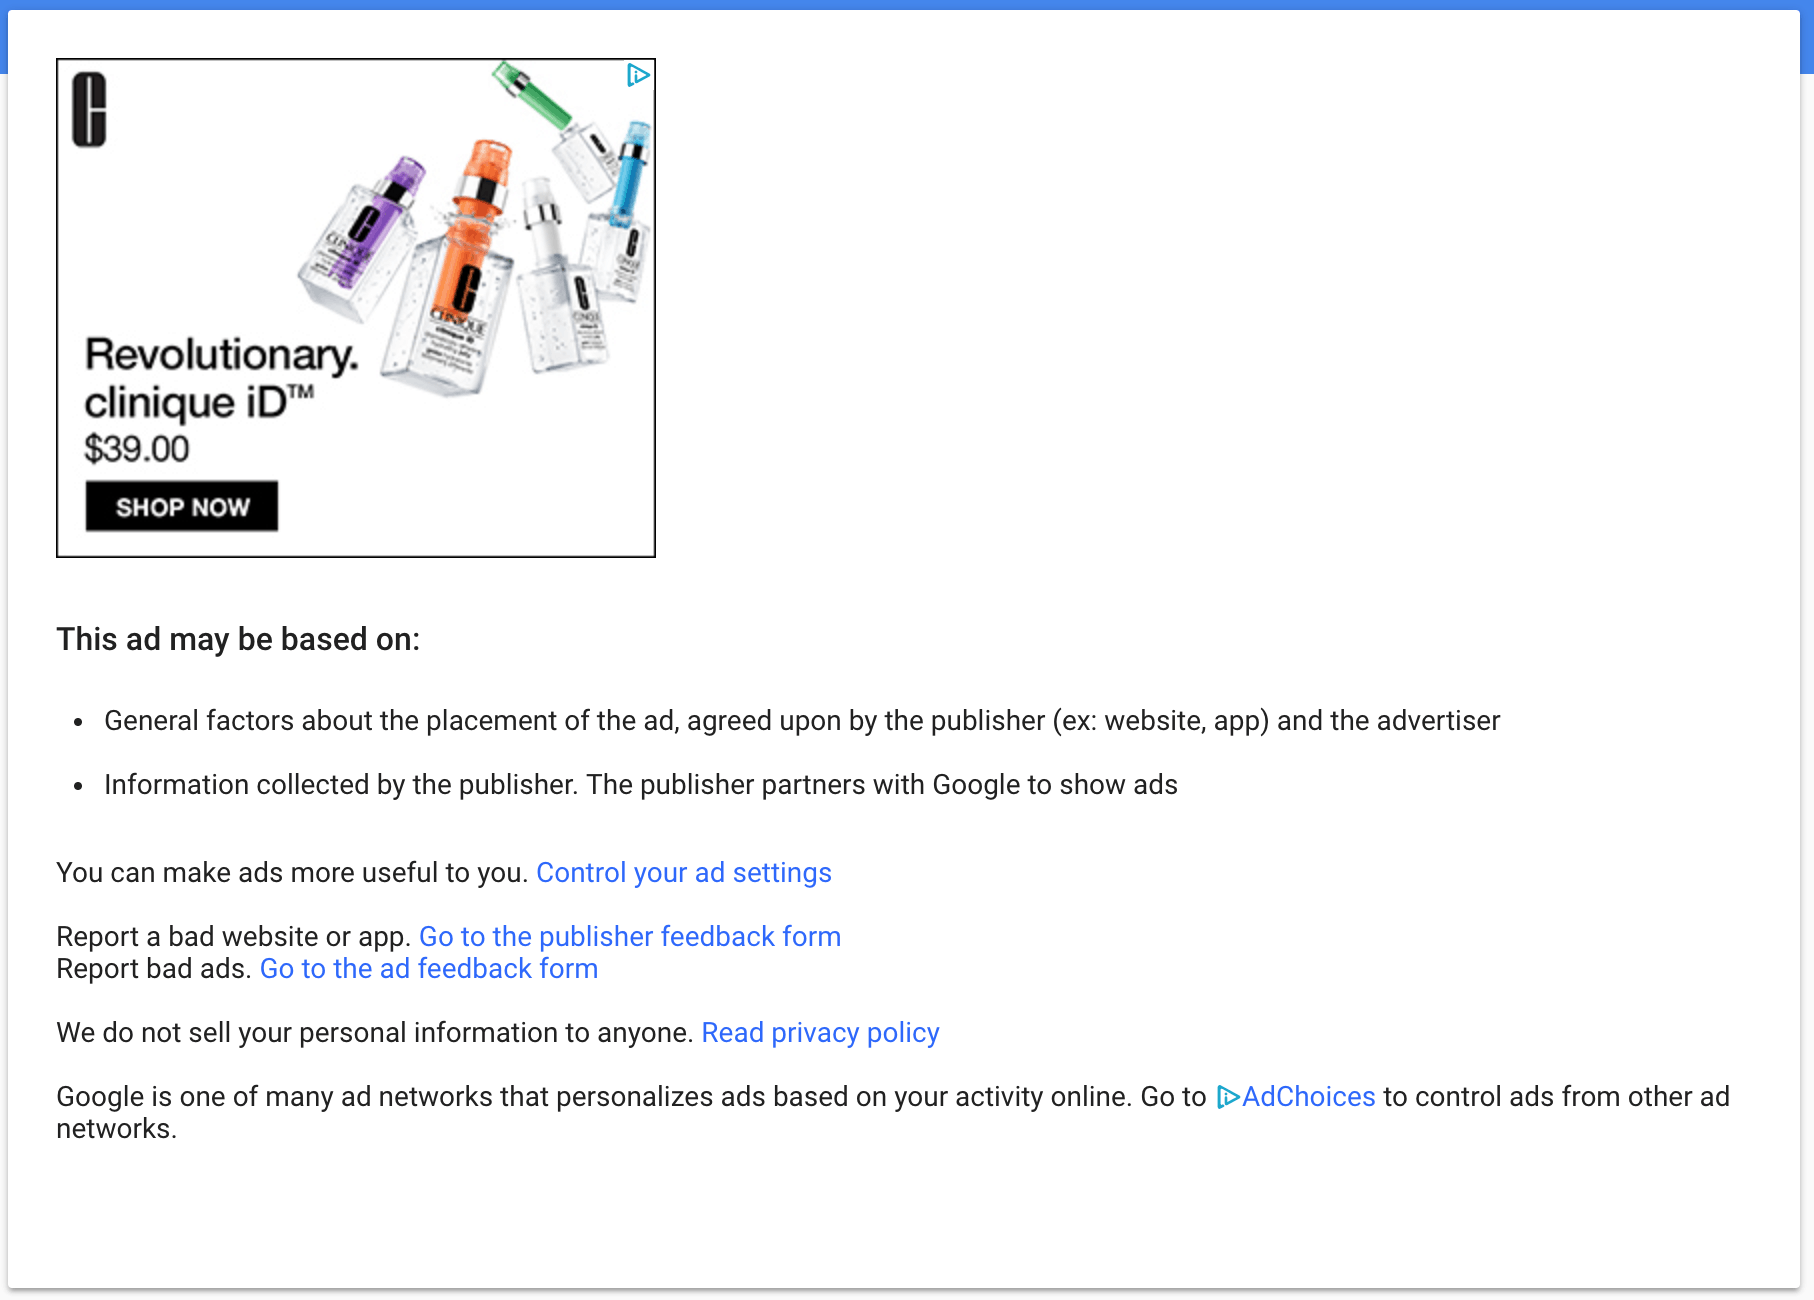 Google AdWords displays your remarketing ad to websites in the Google Display Network. Google claims the network reaches “90% of Internet users online” across news, blogs, and popular Google products like YouTube and Gmail. This ensures that your product or service reaches past website visitors in places they will notice.
Site Search
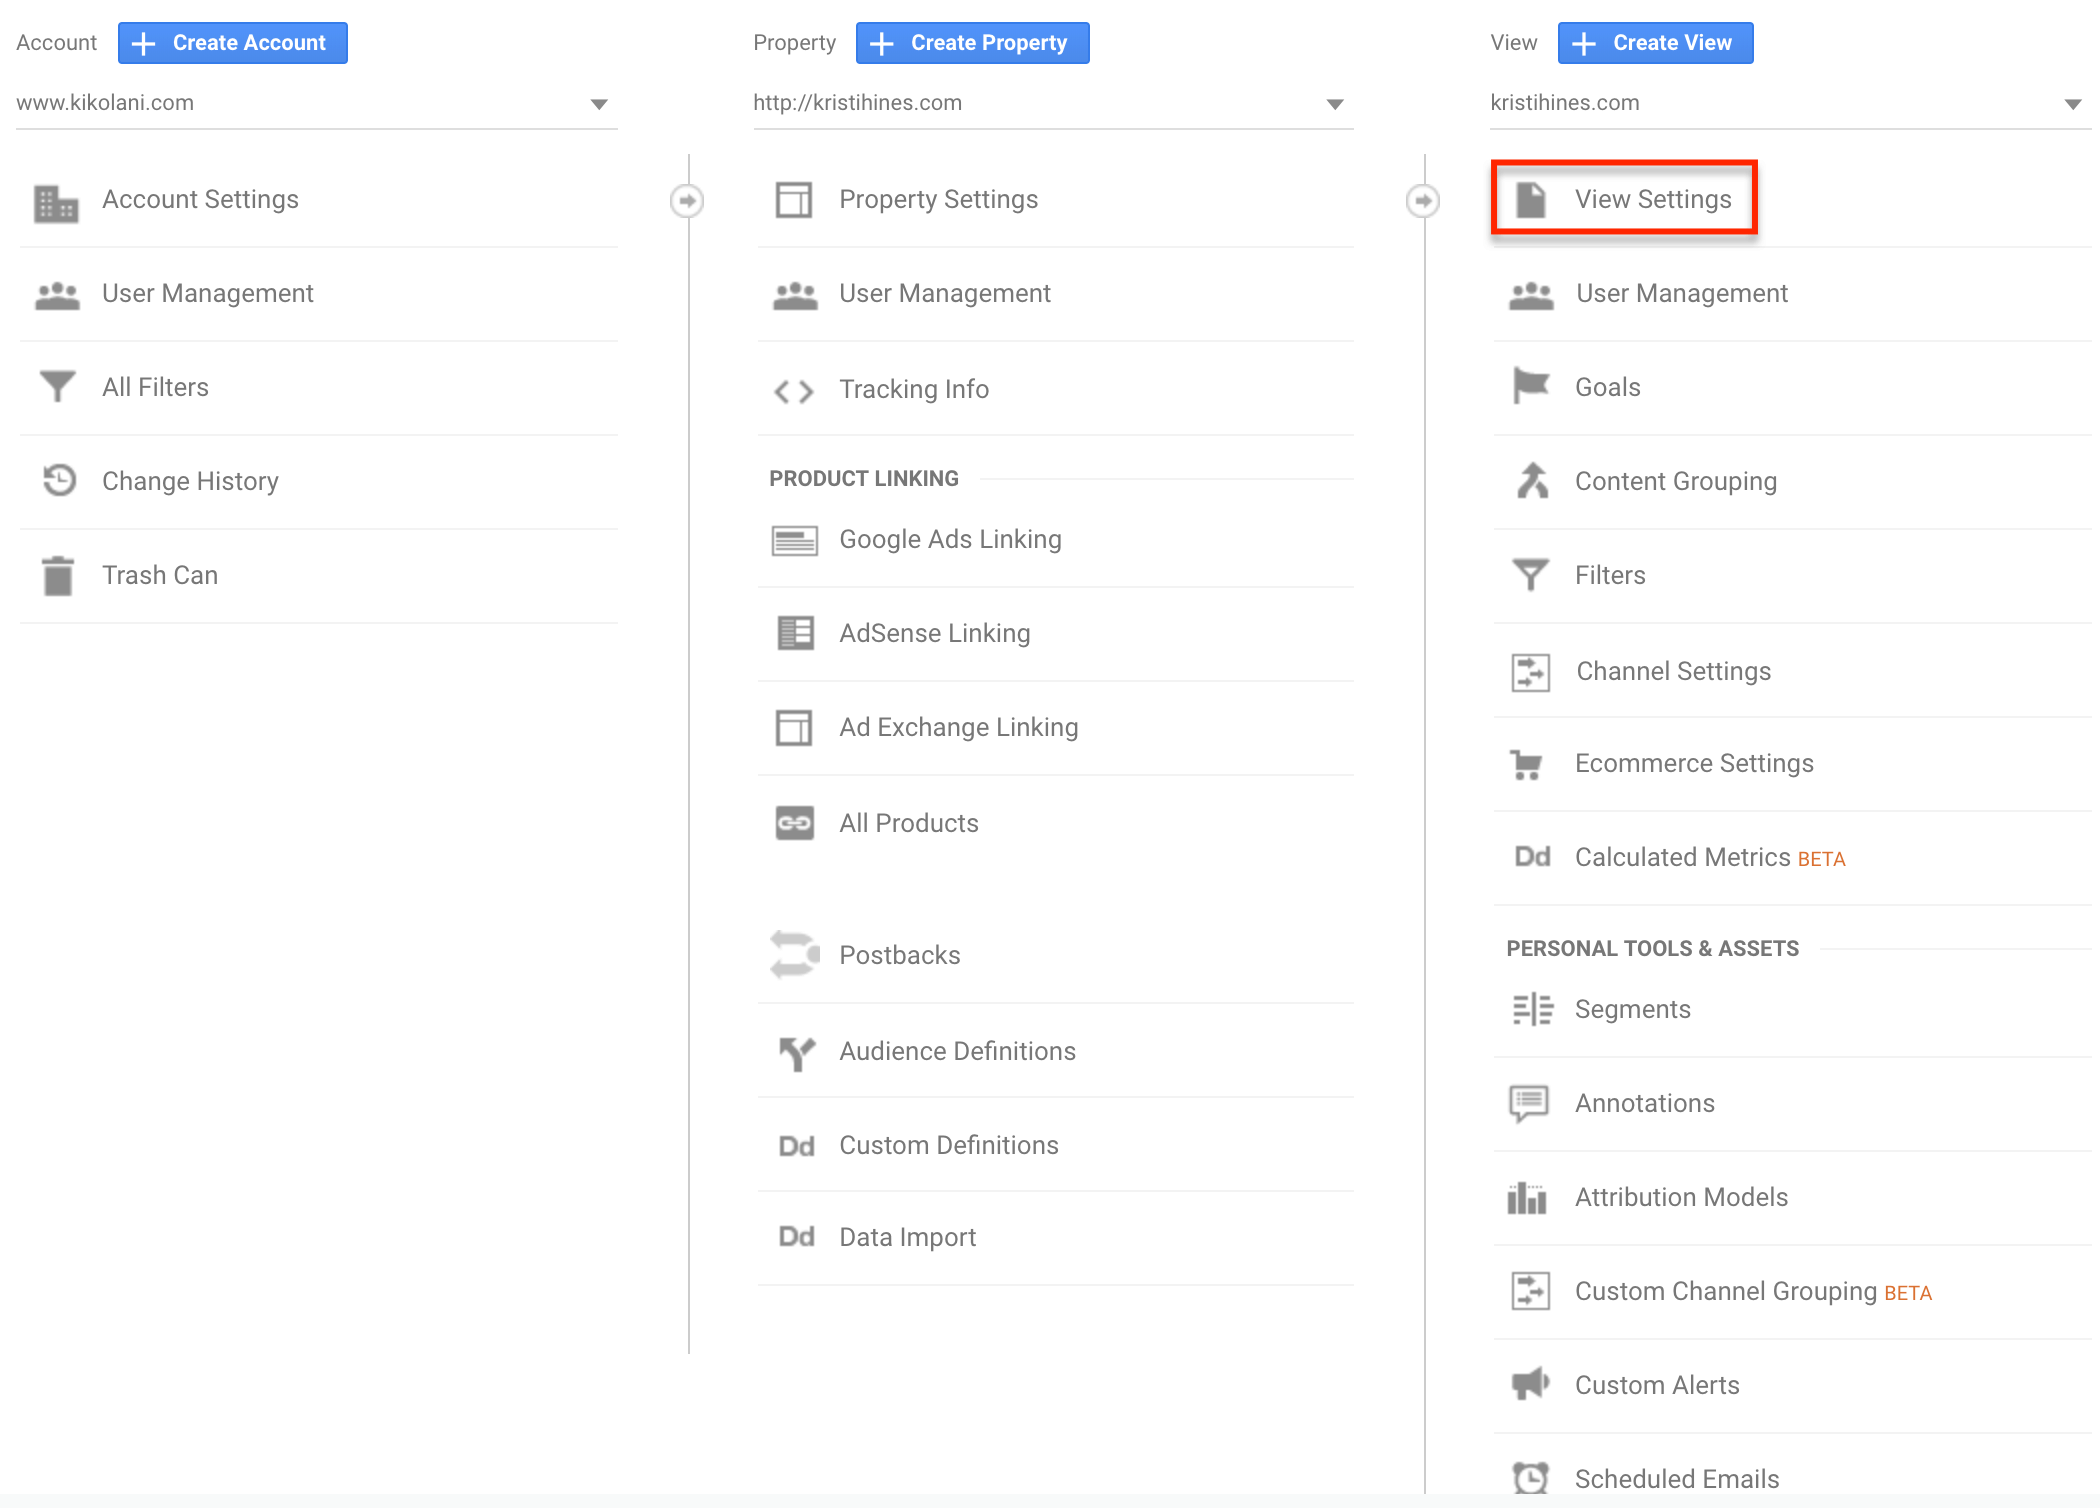
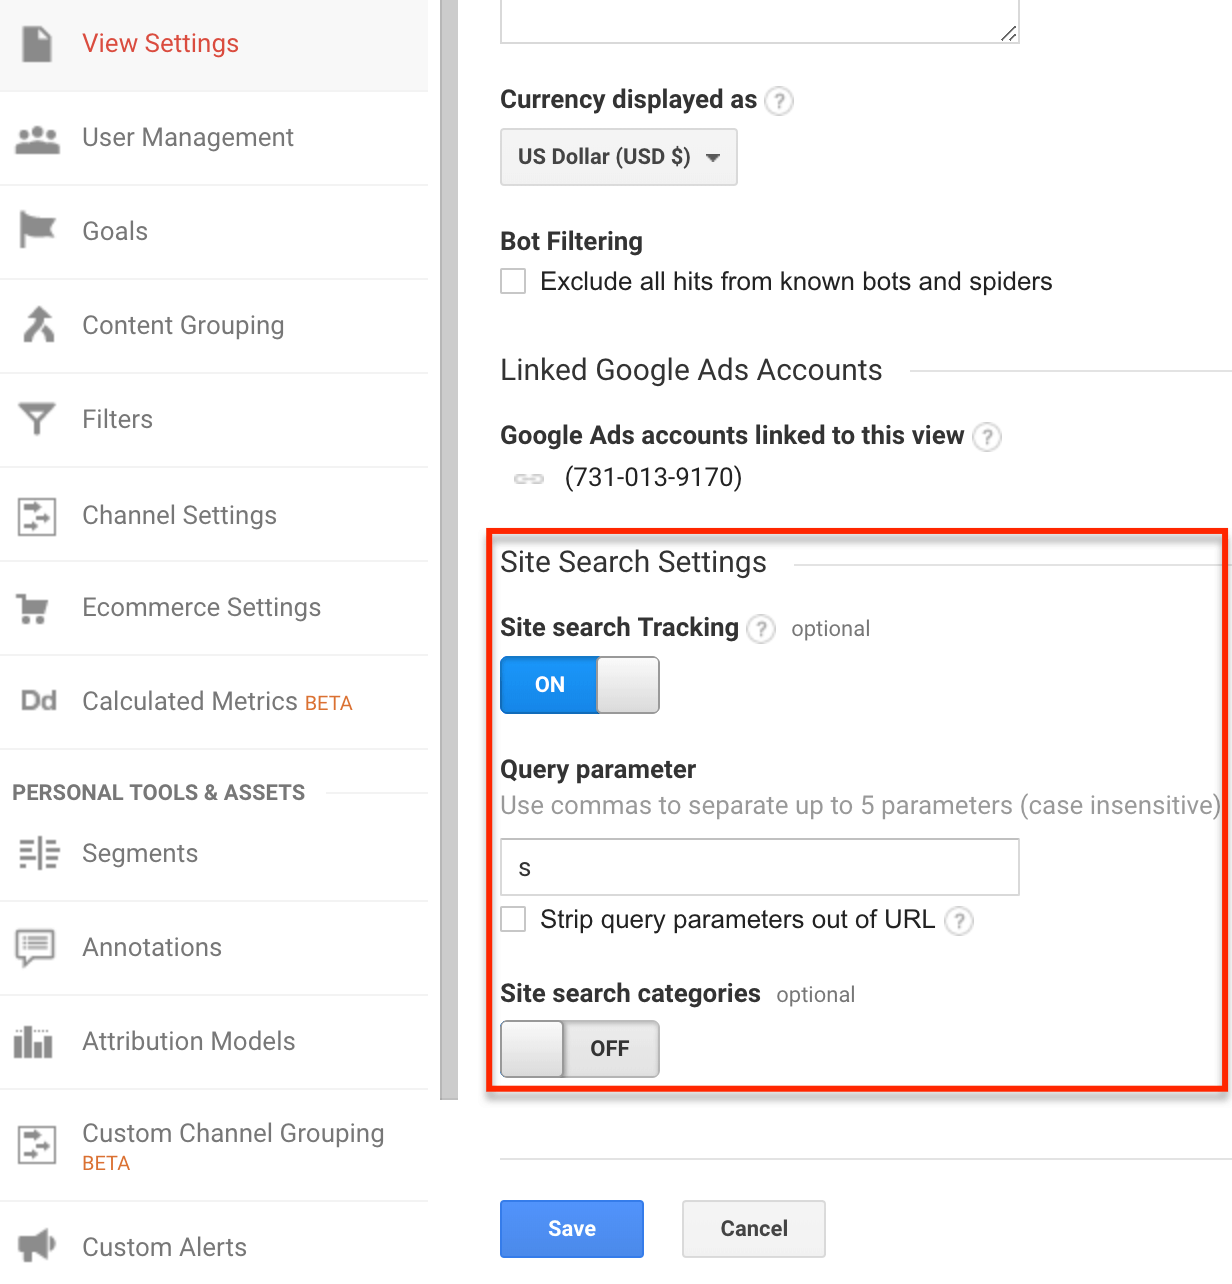
If your website has a search box, you can track the queries made by your users by configuring your Site Search setting. To do this, search for something on your website and look at the letter preceding the query in the search results URL.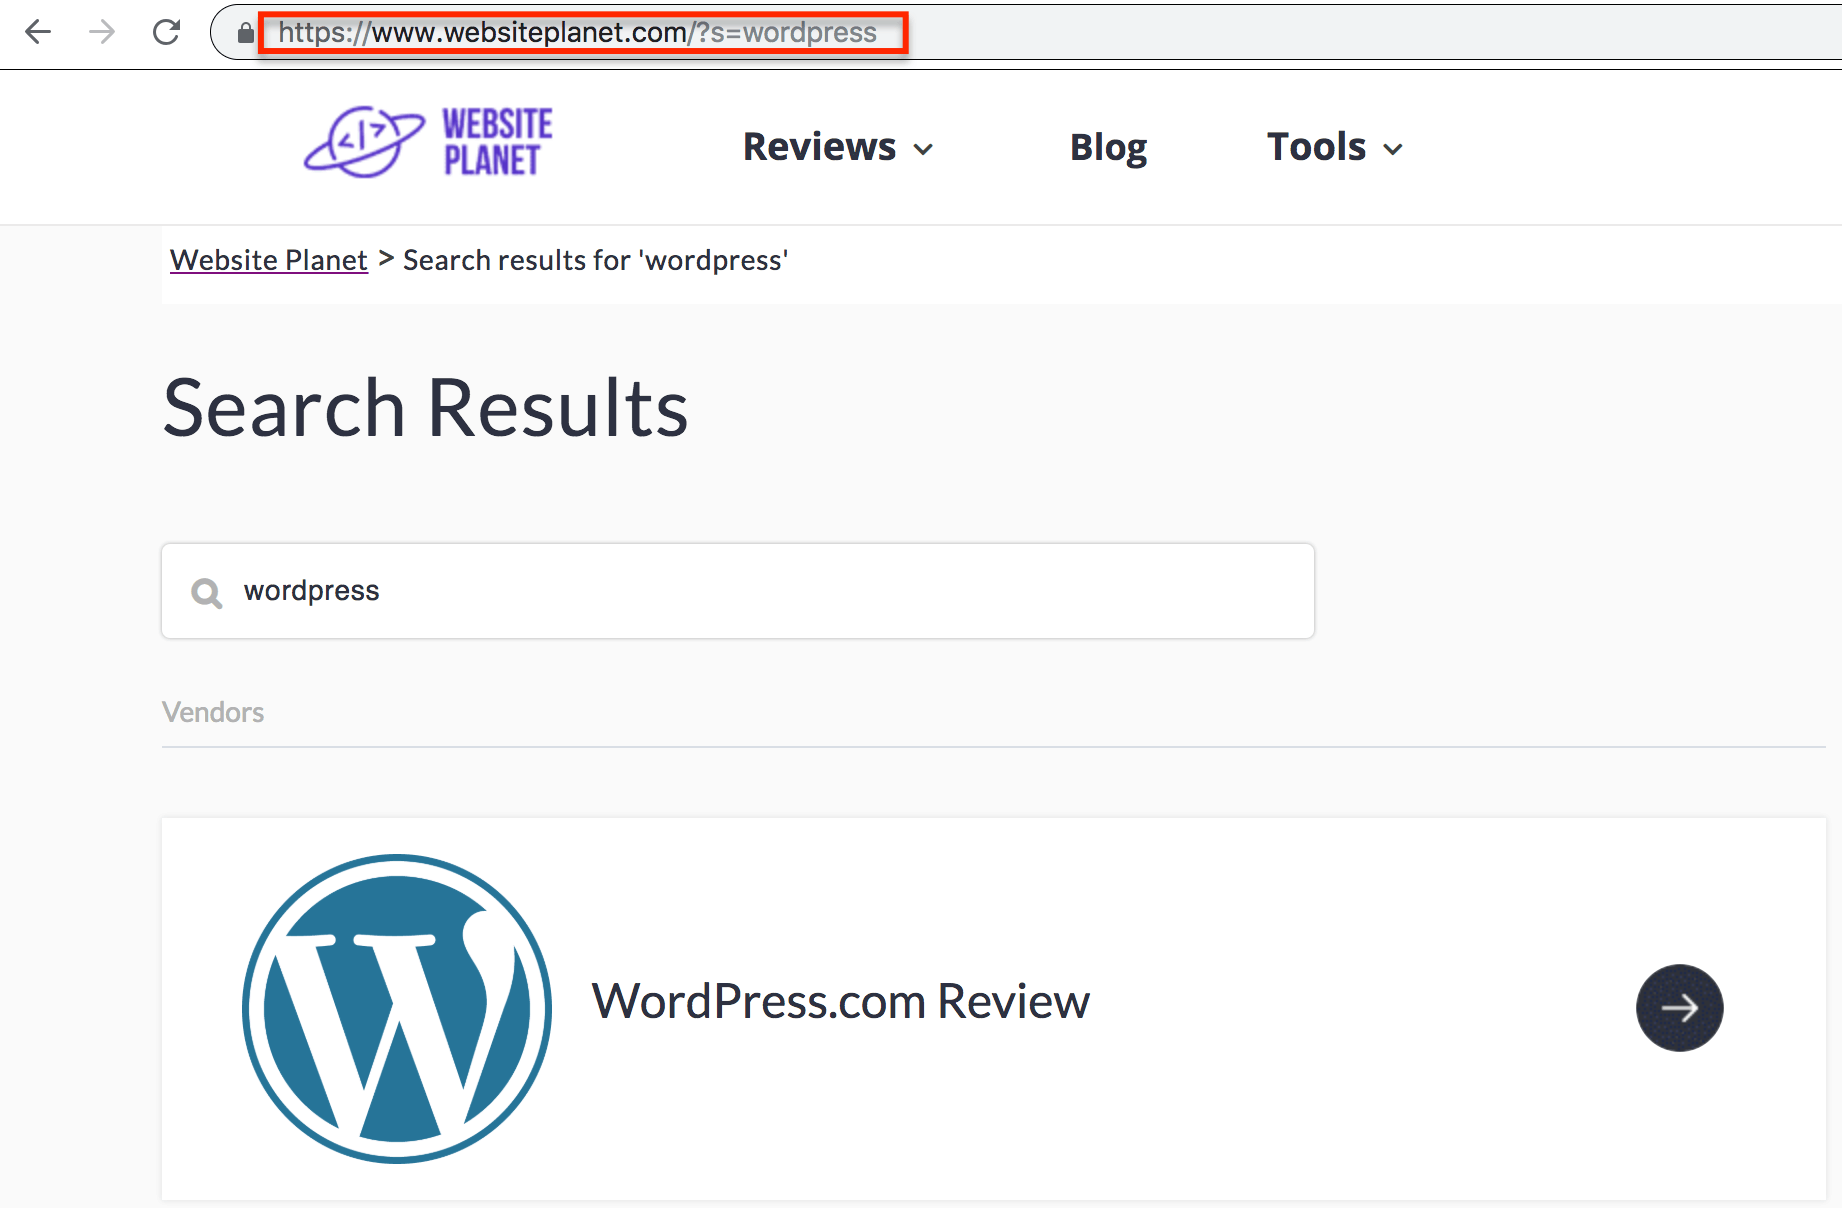 That is what you will need to enter in your Site Search settings. To find Site Search, click on View Settings in the Admin dashboard.
 Scroll down until you see Site Search. Toggle it on and enter the query parameter letter.
 Google Analytics may not show you the keywords users enter in organic Google search queries that lead to your website or app, but it can tell you what some users search for once they arrive. You can use these keywords to create faster navigation to the pages users want the most, improving the user experience.
Search Console
Google Search Console is a free tool for website owners who want to monitor the health of their website in Google Search results. If you already use it, you can connect it to your Google Analytics to pull in data about your top landing pages and queries entered in organic Google search. The option can be found in Property Settings in the Admin dashboard or the Search Console section under Acquisition in the left sidebar menu.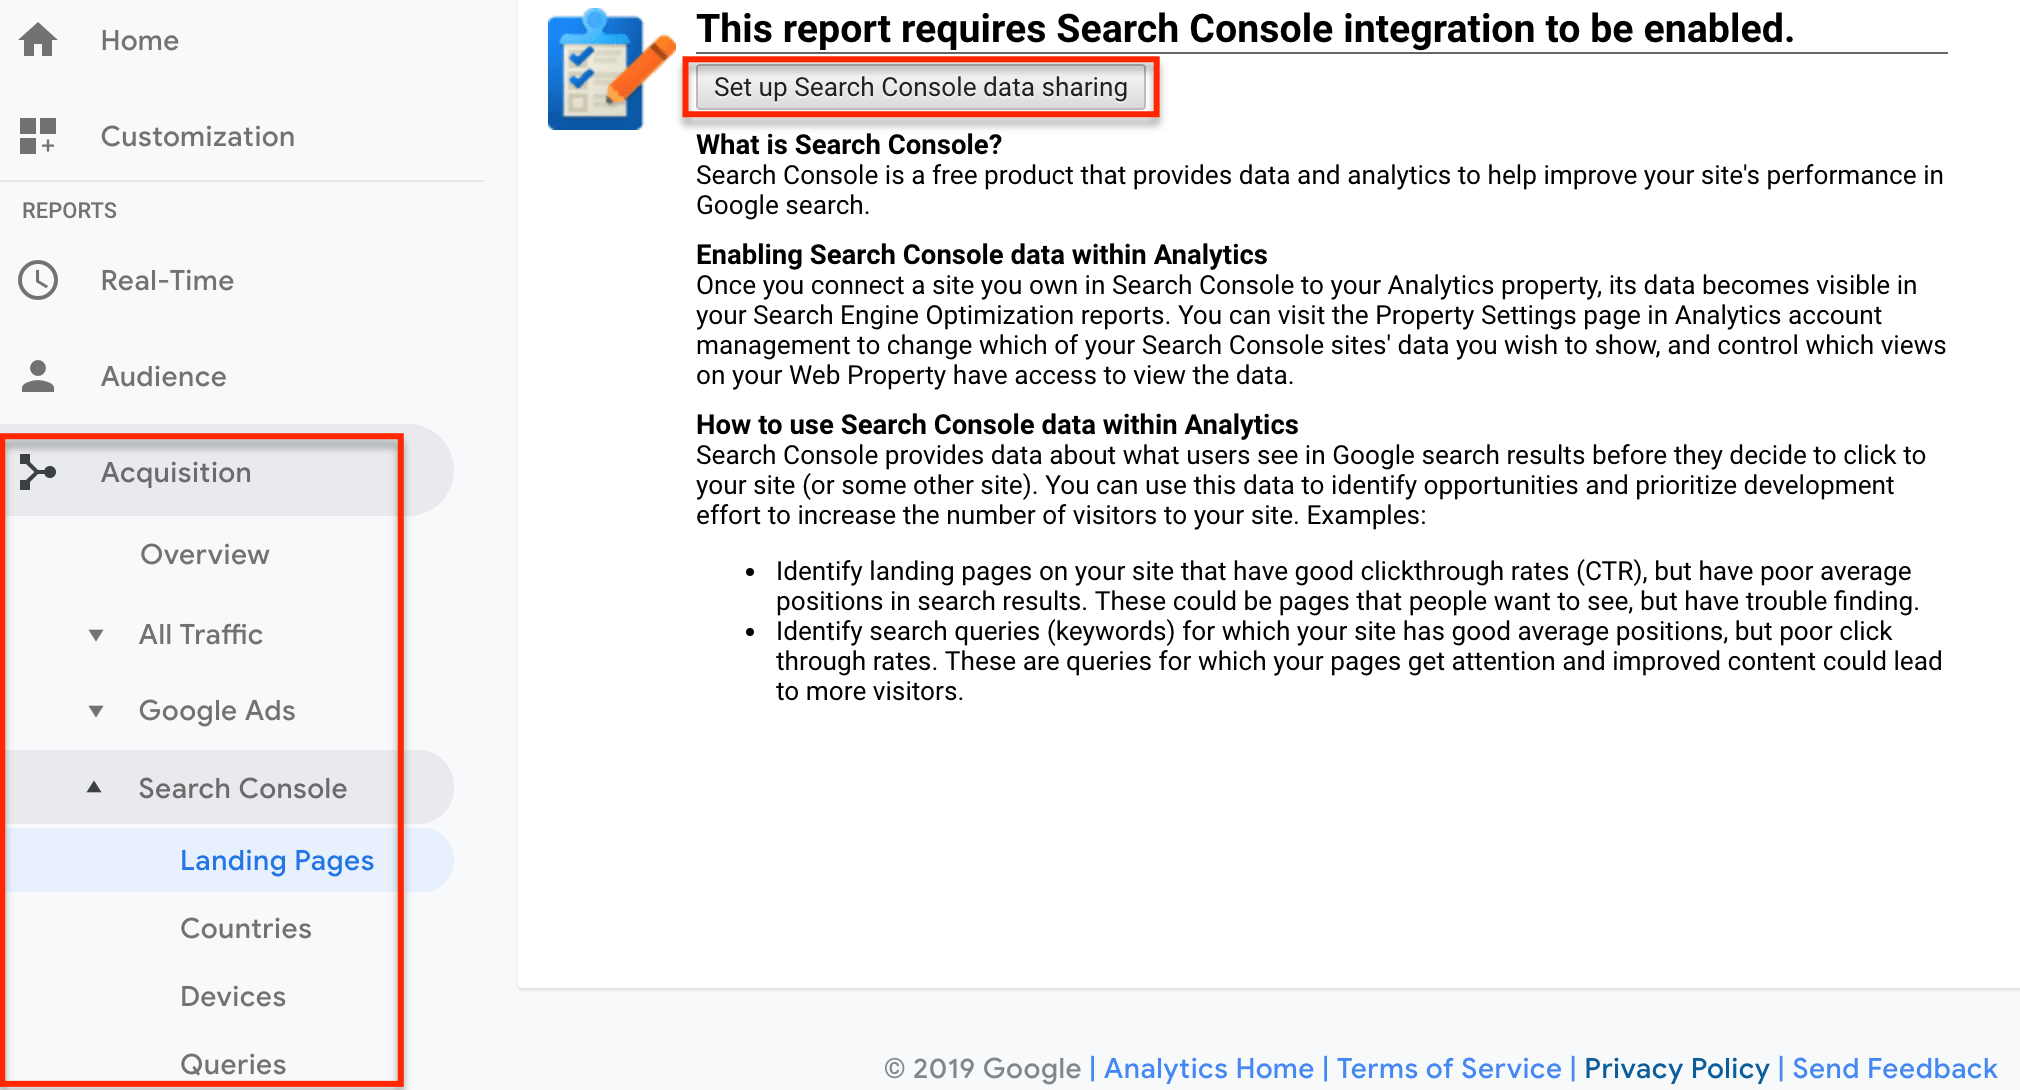 Clicking on the button to set up data sharing with Search Console will redirect you to the Property Settings for your website or app in the Admin dashboard. Scroll down until you see the Search Console section.
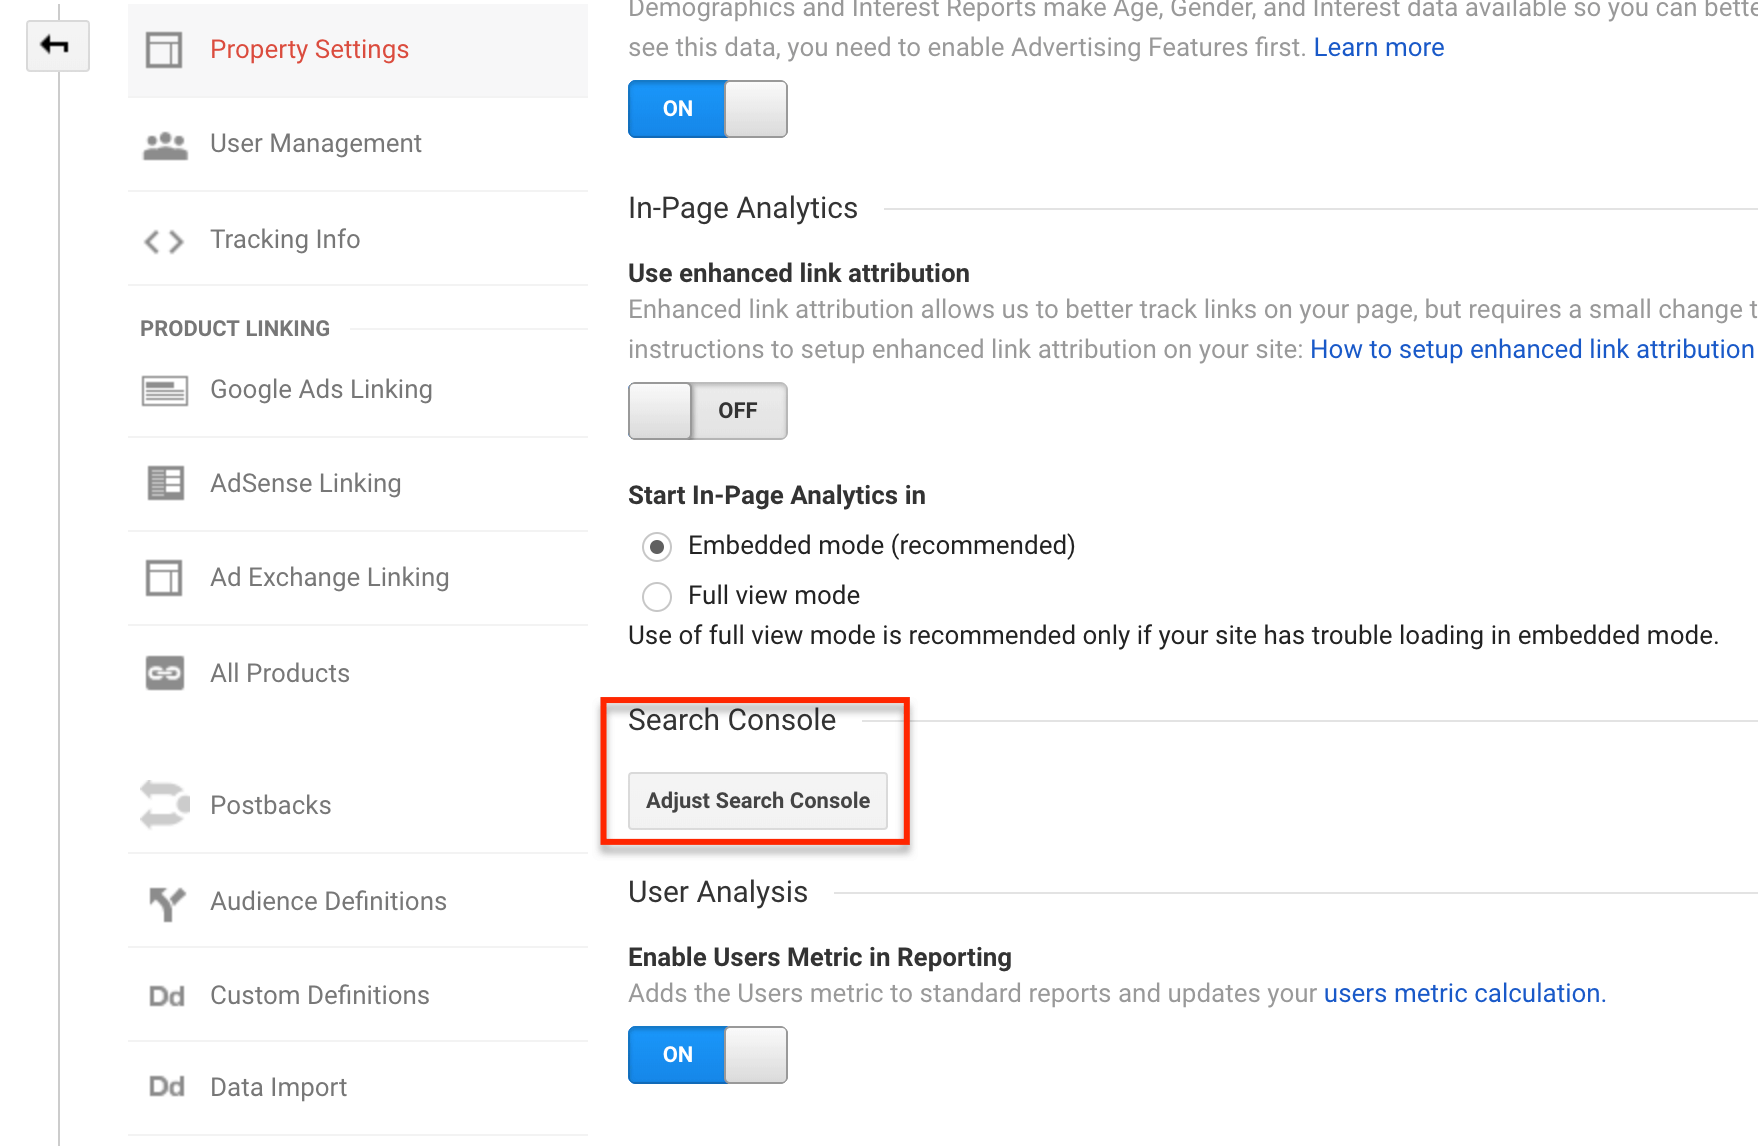 Click on the button to link your website or app in Google Search Console to your Google Analytics account. Allow Google Analytics a few days to start receiving information from Search Console – most notably, more of the search queries users enter into Google search.
Reviewing Google Analytics Reports
Depending on the number of users that engage with your website or app during a specific timeframe, you may need to wait anywhere from a few hours or a few days to start receiving valuable information about your website traffic. Here are some of the top reports to view and how you can use them to help your business. Access these reports and more under the Audience, Acquisition, Behavior, and Conversion categories in the left sidebar menu.Audience > Overview
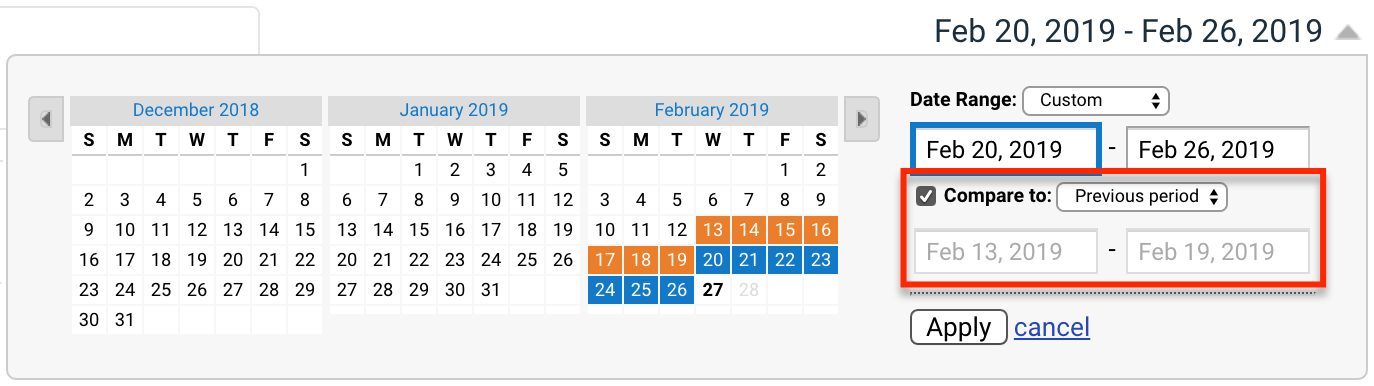
Do you want to see how many users have engaged with your website or app? Review the Audience Overview report, using the date selector at the top right of the report to view data over a specific timeframe.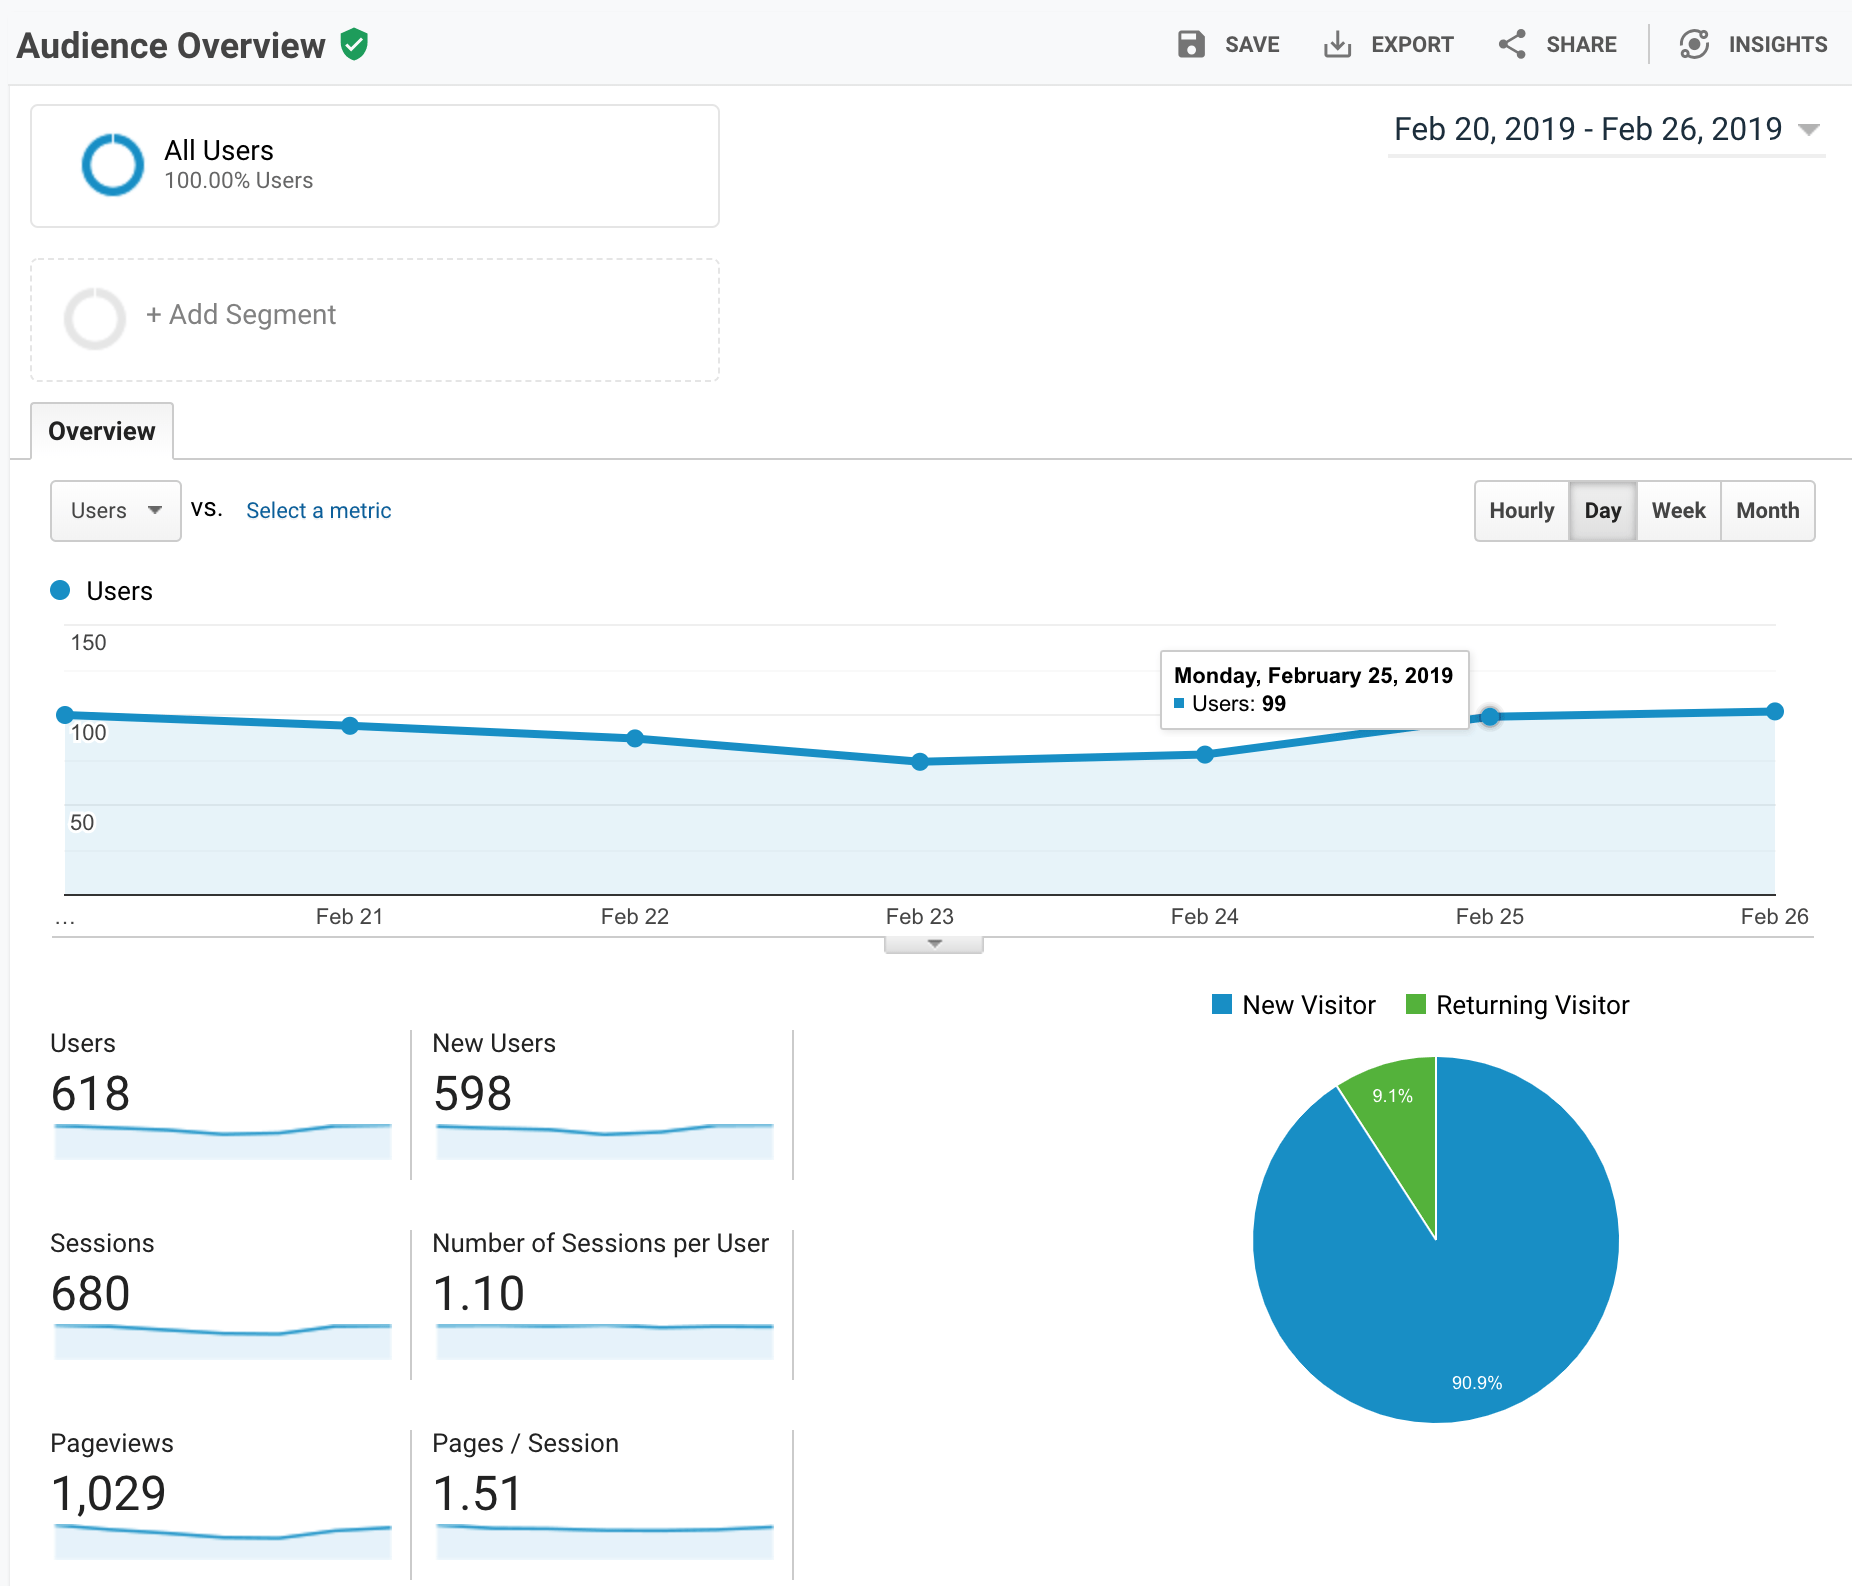 Use the Compare to option to see if your website or app traffic has increased or decreased between two time periods, such as this week vs. last week, this month vs. last month, and similar settings.
Demographics > Overview
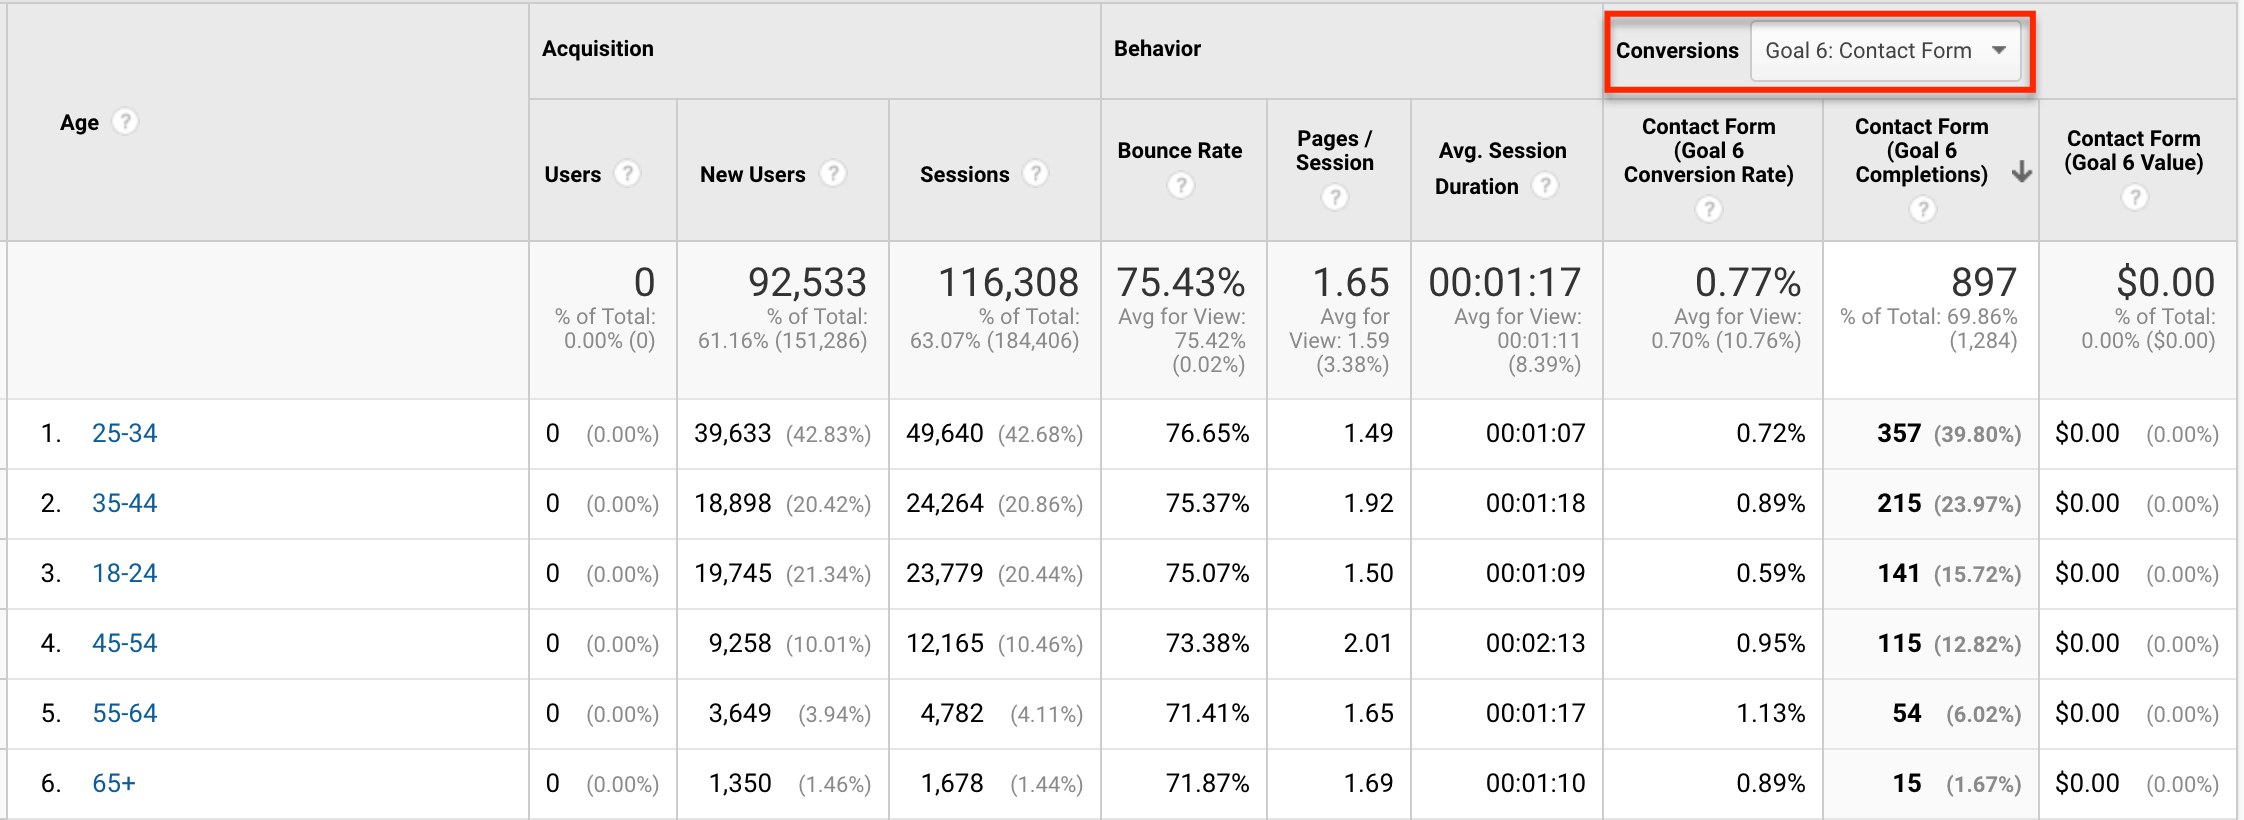
See how many users fit in a particular age group or gender in the Demographics > Overview report.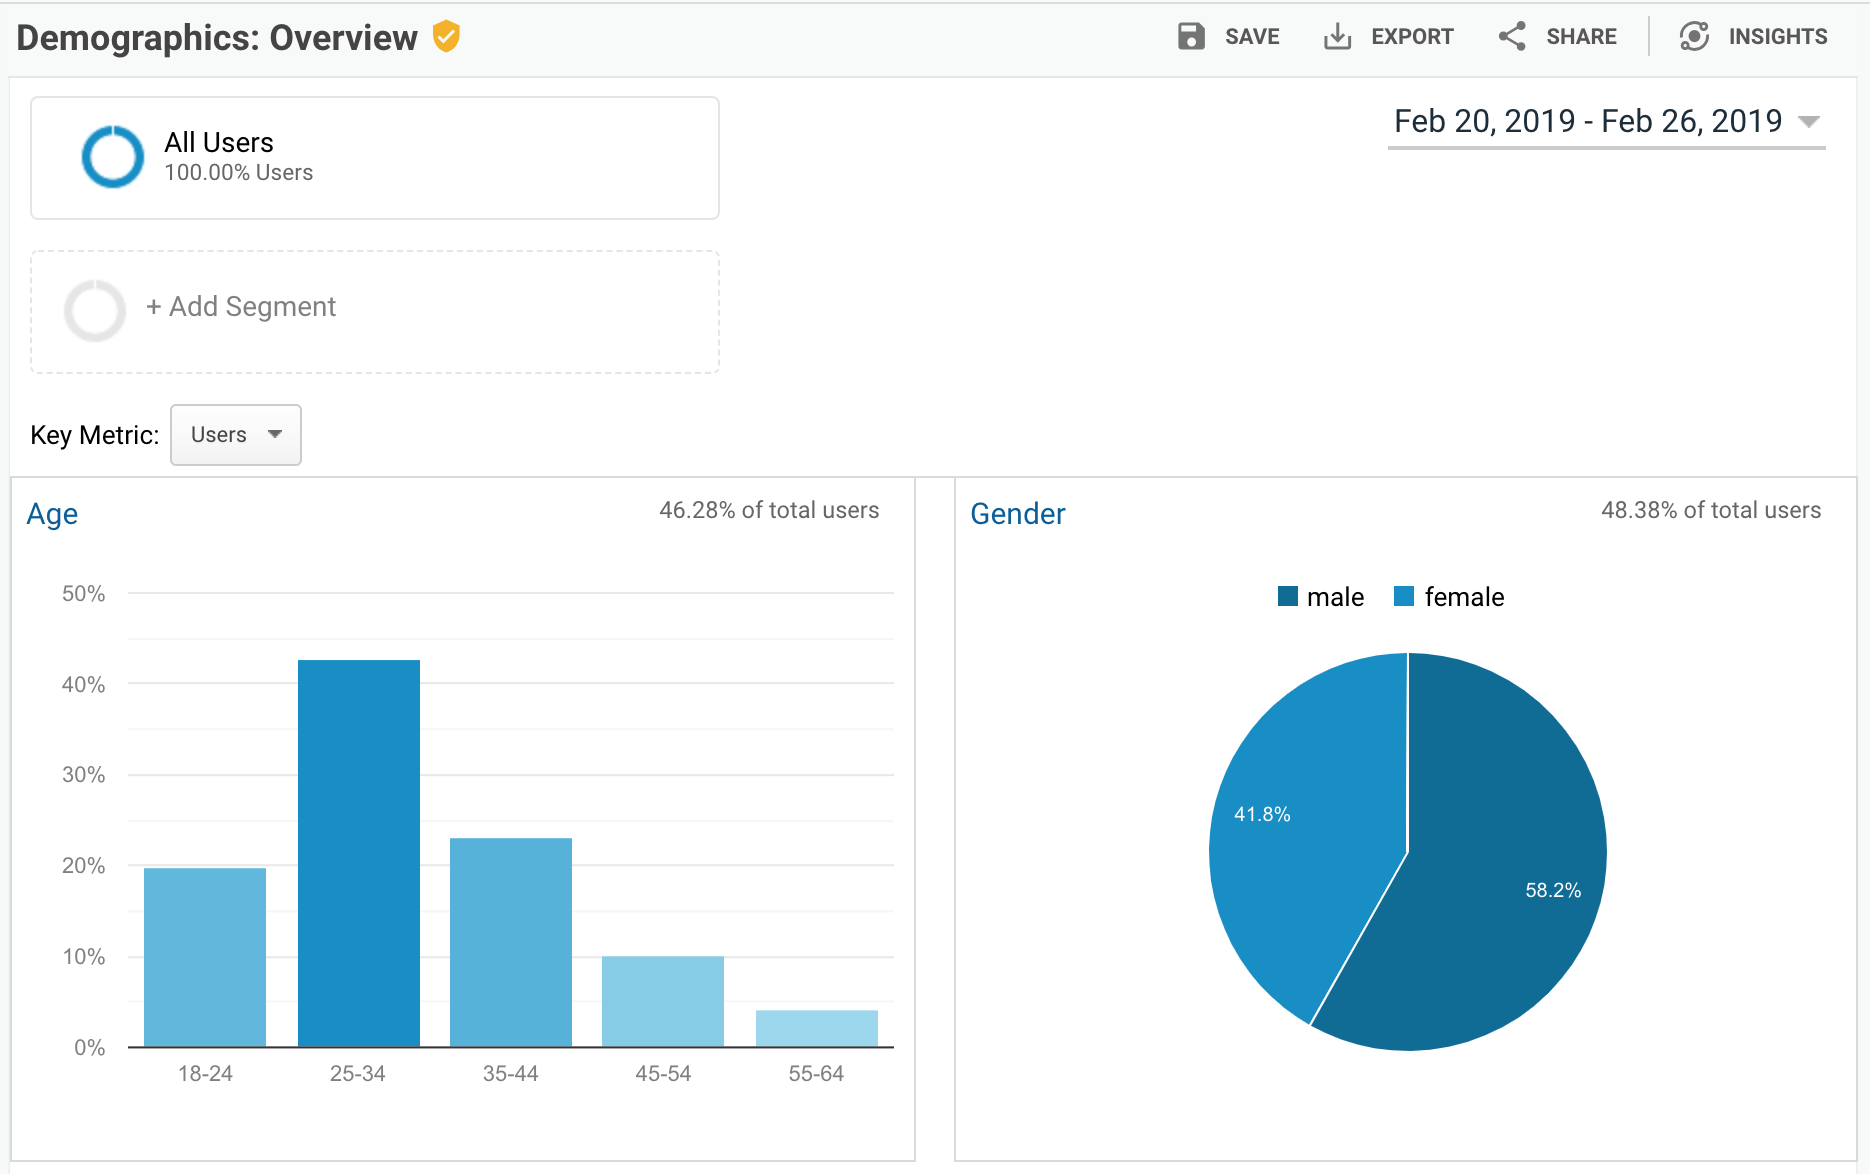 If you set up a Google Analytics Goal as suggested earlier, visit the detailed Age and Gender reports under Demographics. Use the dropdown to switch between multiple goals and sort using the column for Goal Completions to see which age groups and gender convert best.
 Use this information to help you create better pay per click ads on Google, Facebook, and other ad networks by targeting ads to high-converting age groups and genders.
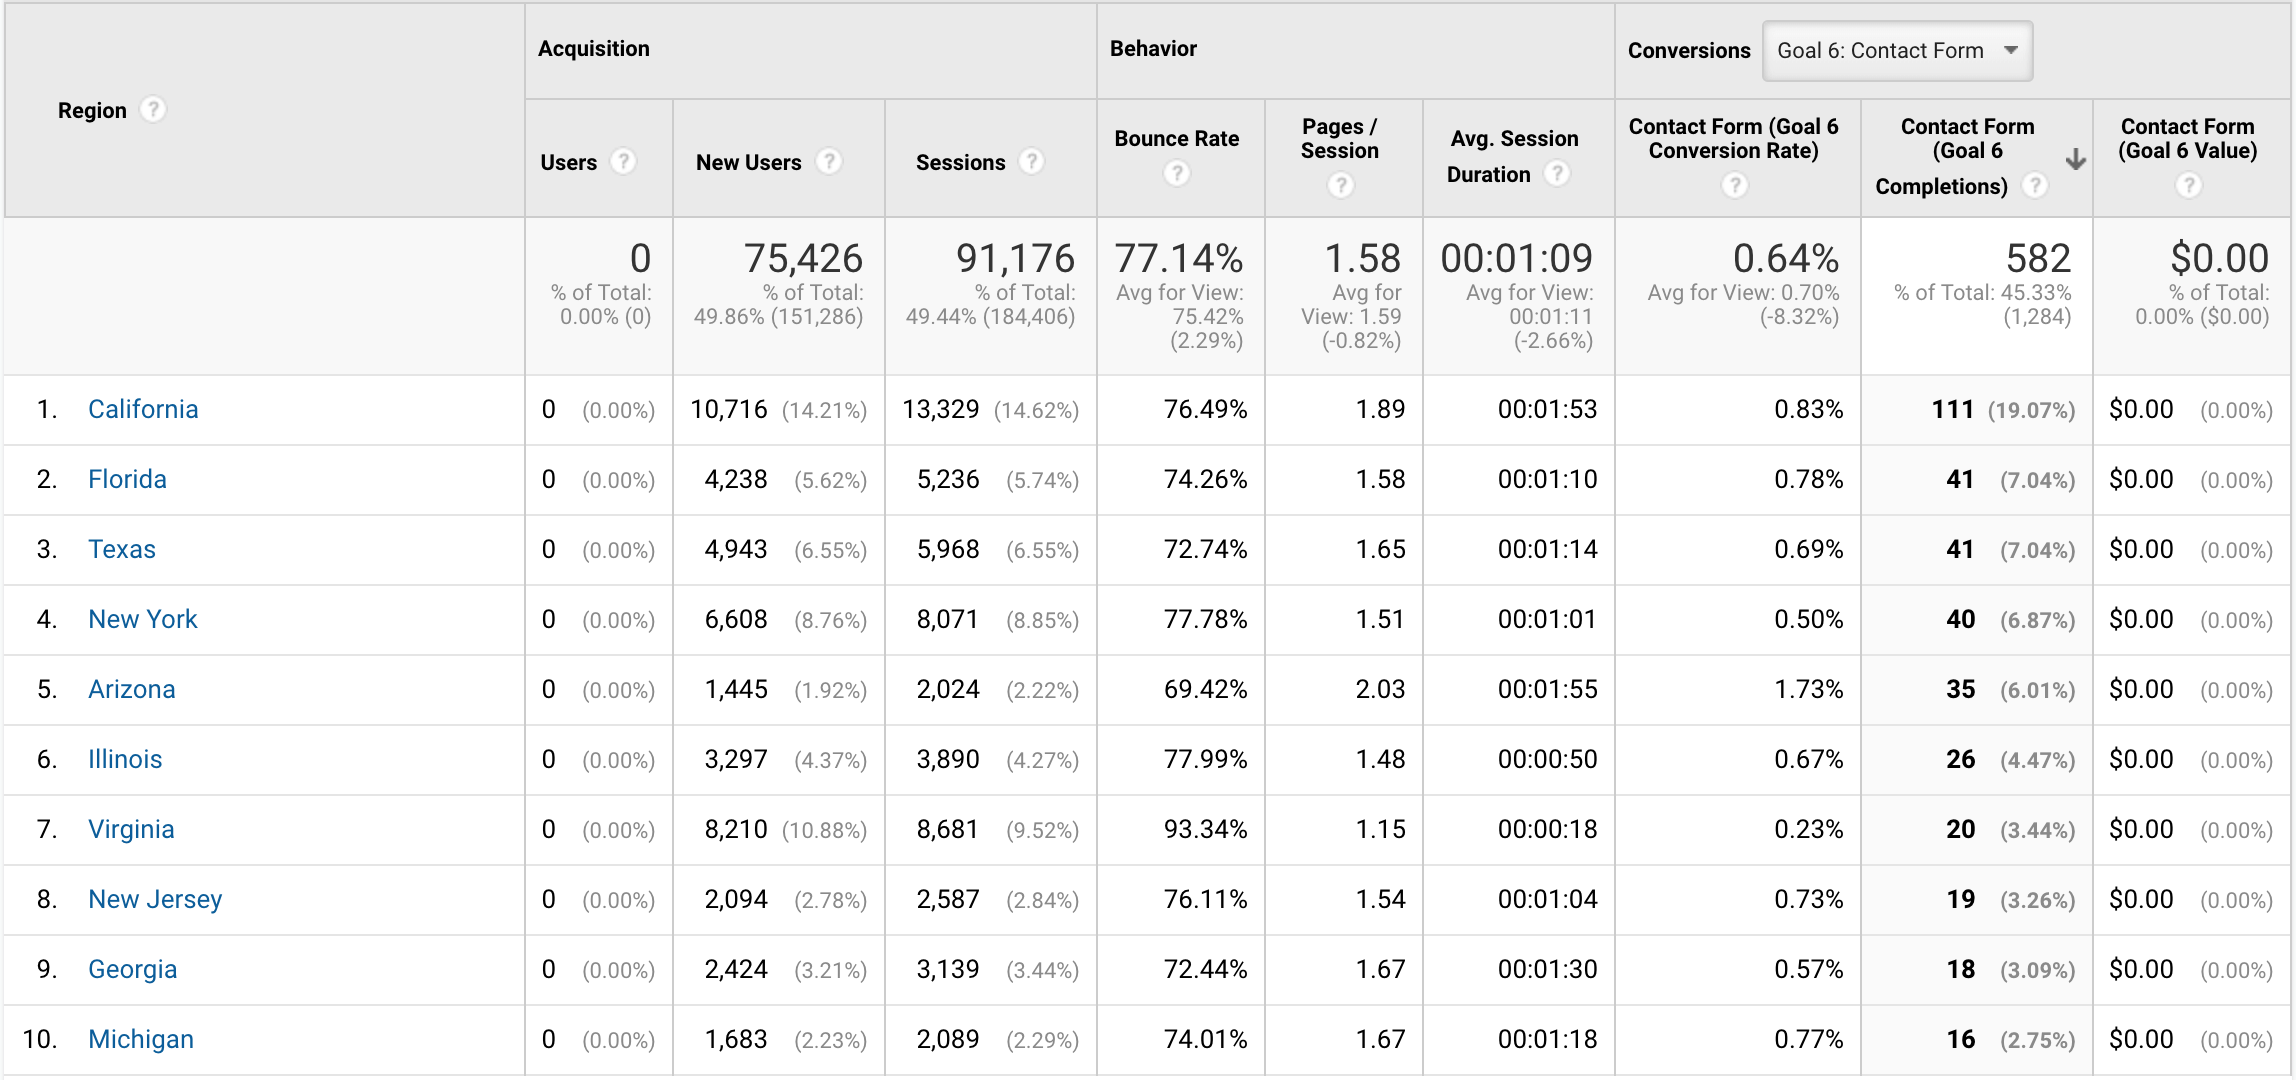
Audience > Geo Language & Location
Use these reports to show the number of users who visit your website broken down by the language chosen in the user’s browser settings or the user’s location. Sort by specific Goal Completions to see where users who convert are from and the language they speak most.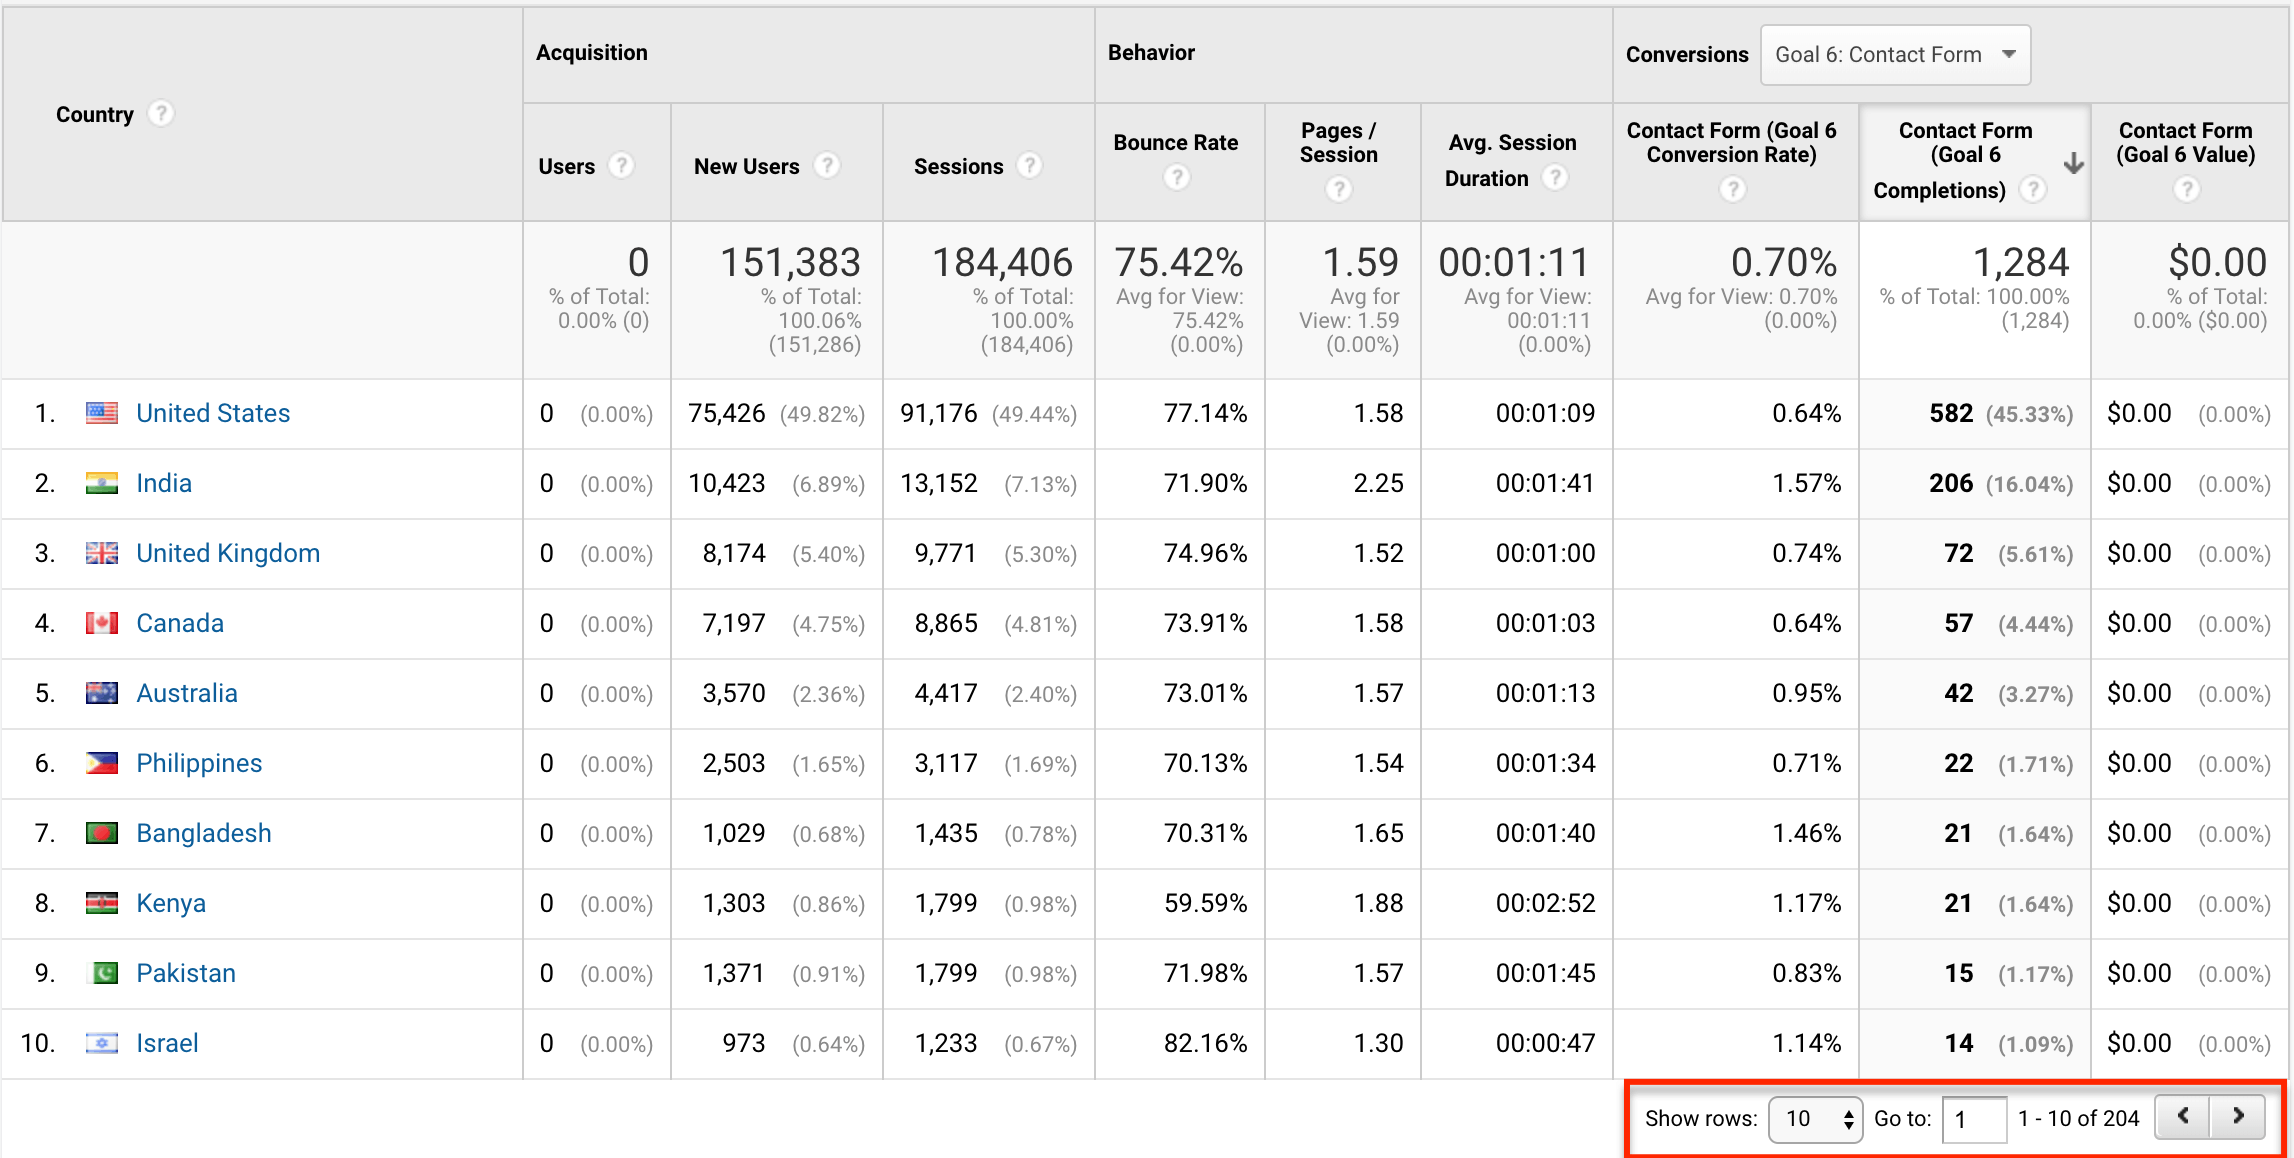 Select the dropdown to show more rows or switch to the next section of data to see more locations and languages that convert. Dive deeper by clicking on top converting countries to get state, county, and city-level details.
Audience > Mobile > Devices
Not sure if you need to optimize your website for mobile users or if you should look into app development for your business? Visit the Devices report to see what devices users access your website with, as well as related conversions data if you have Goals configured.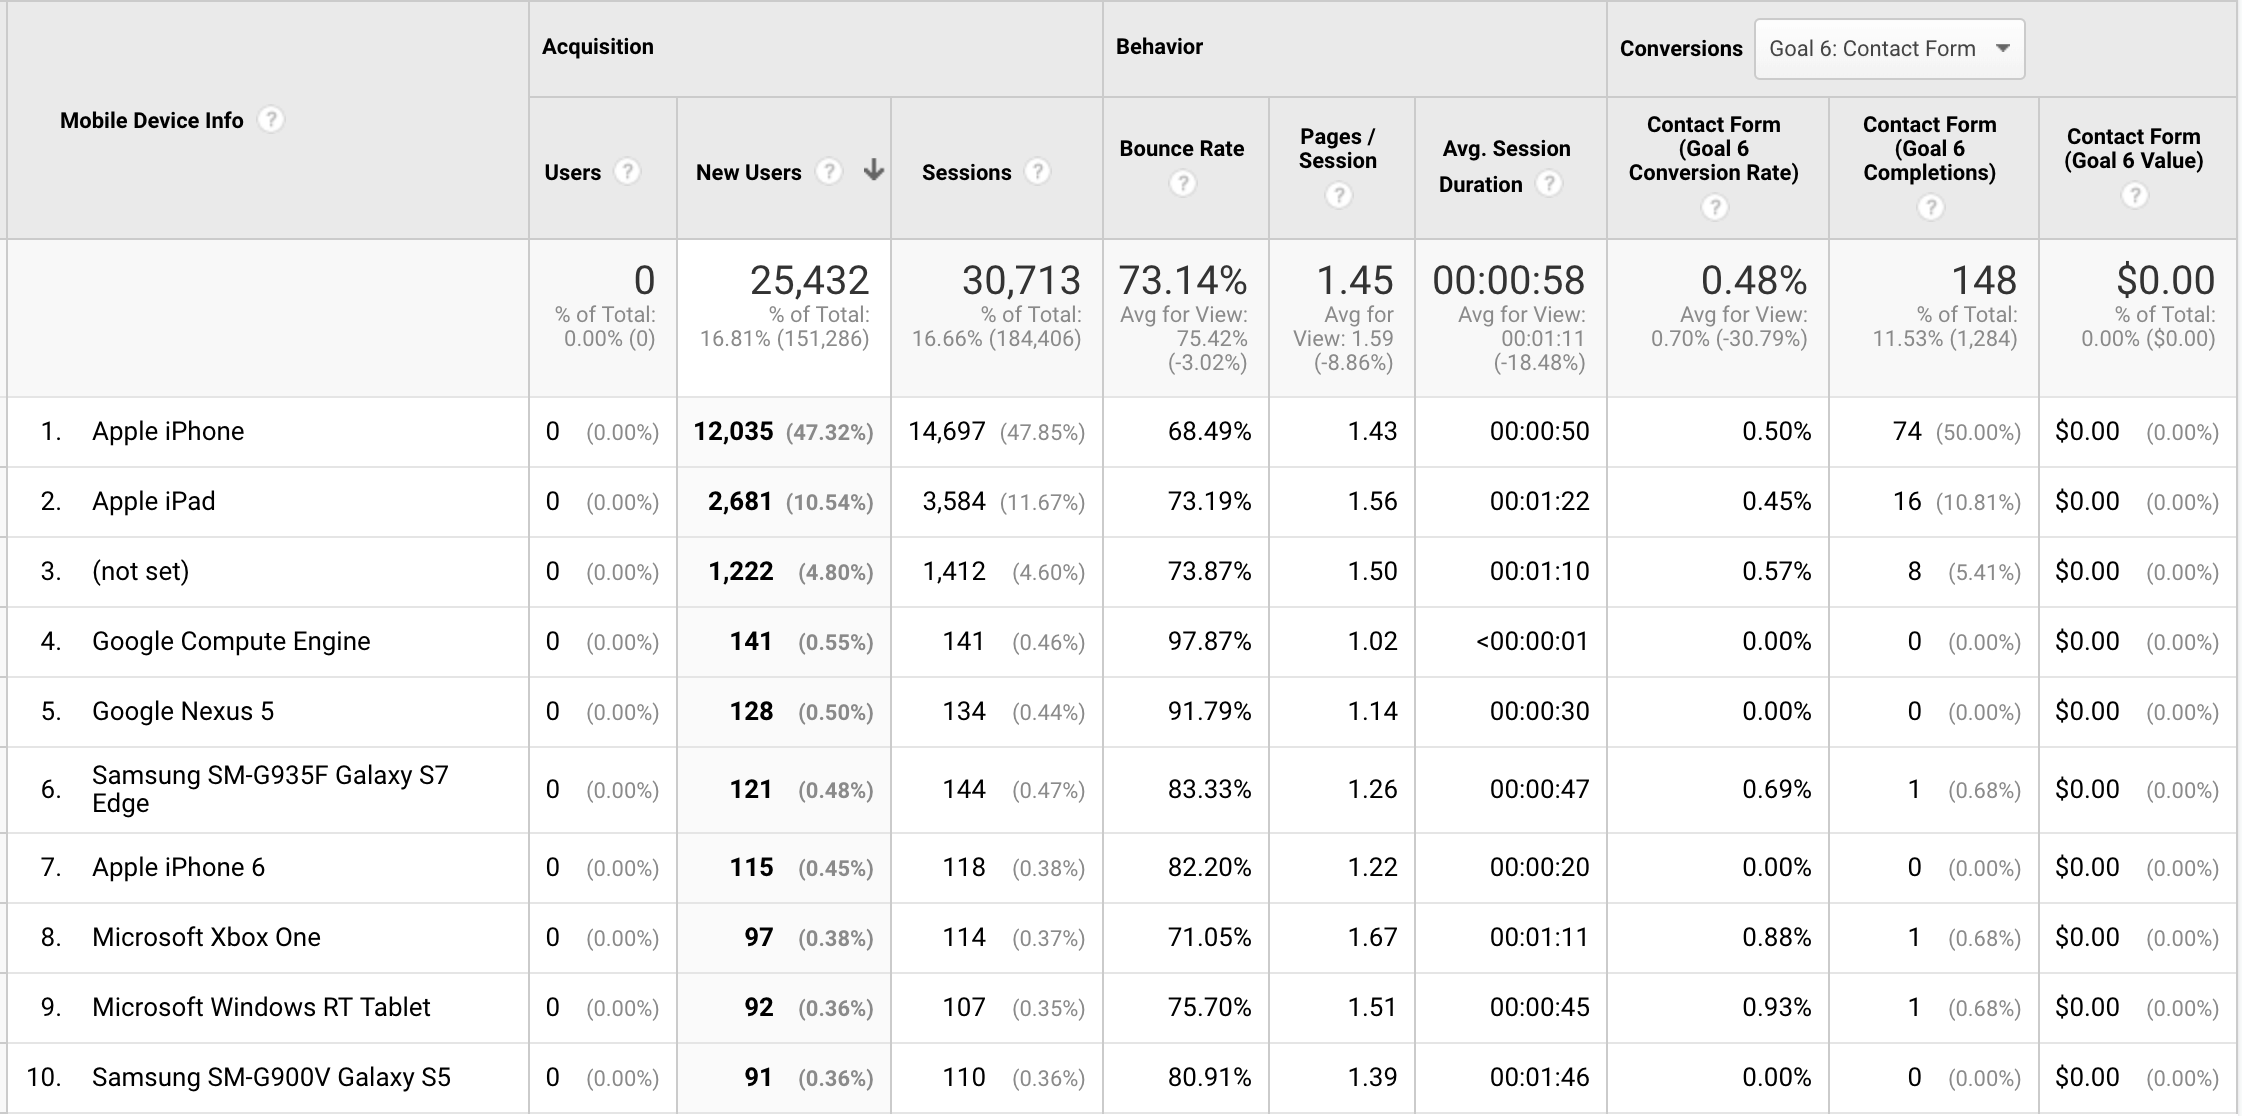 If you notice a particular trend, such as Android users having a higher bounce rate or lower conversion rate than iOS users, you may want to test your website using an Android device to ensure a seamless user experience.
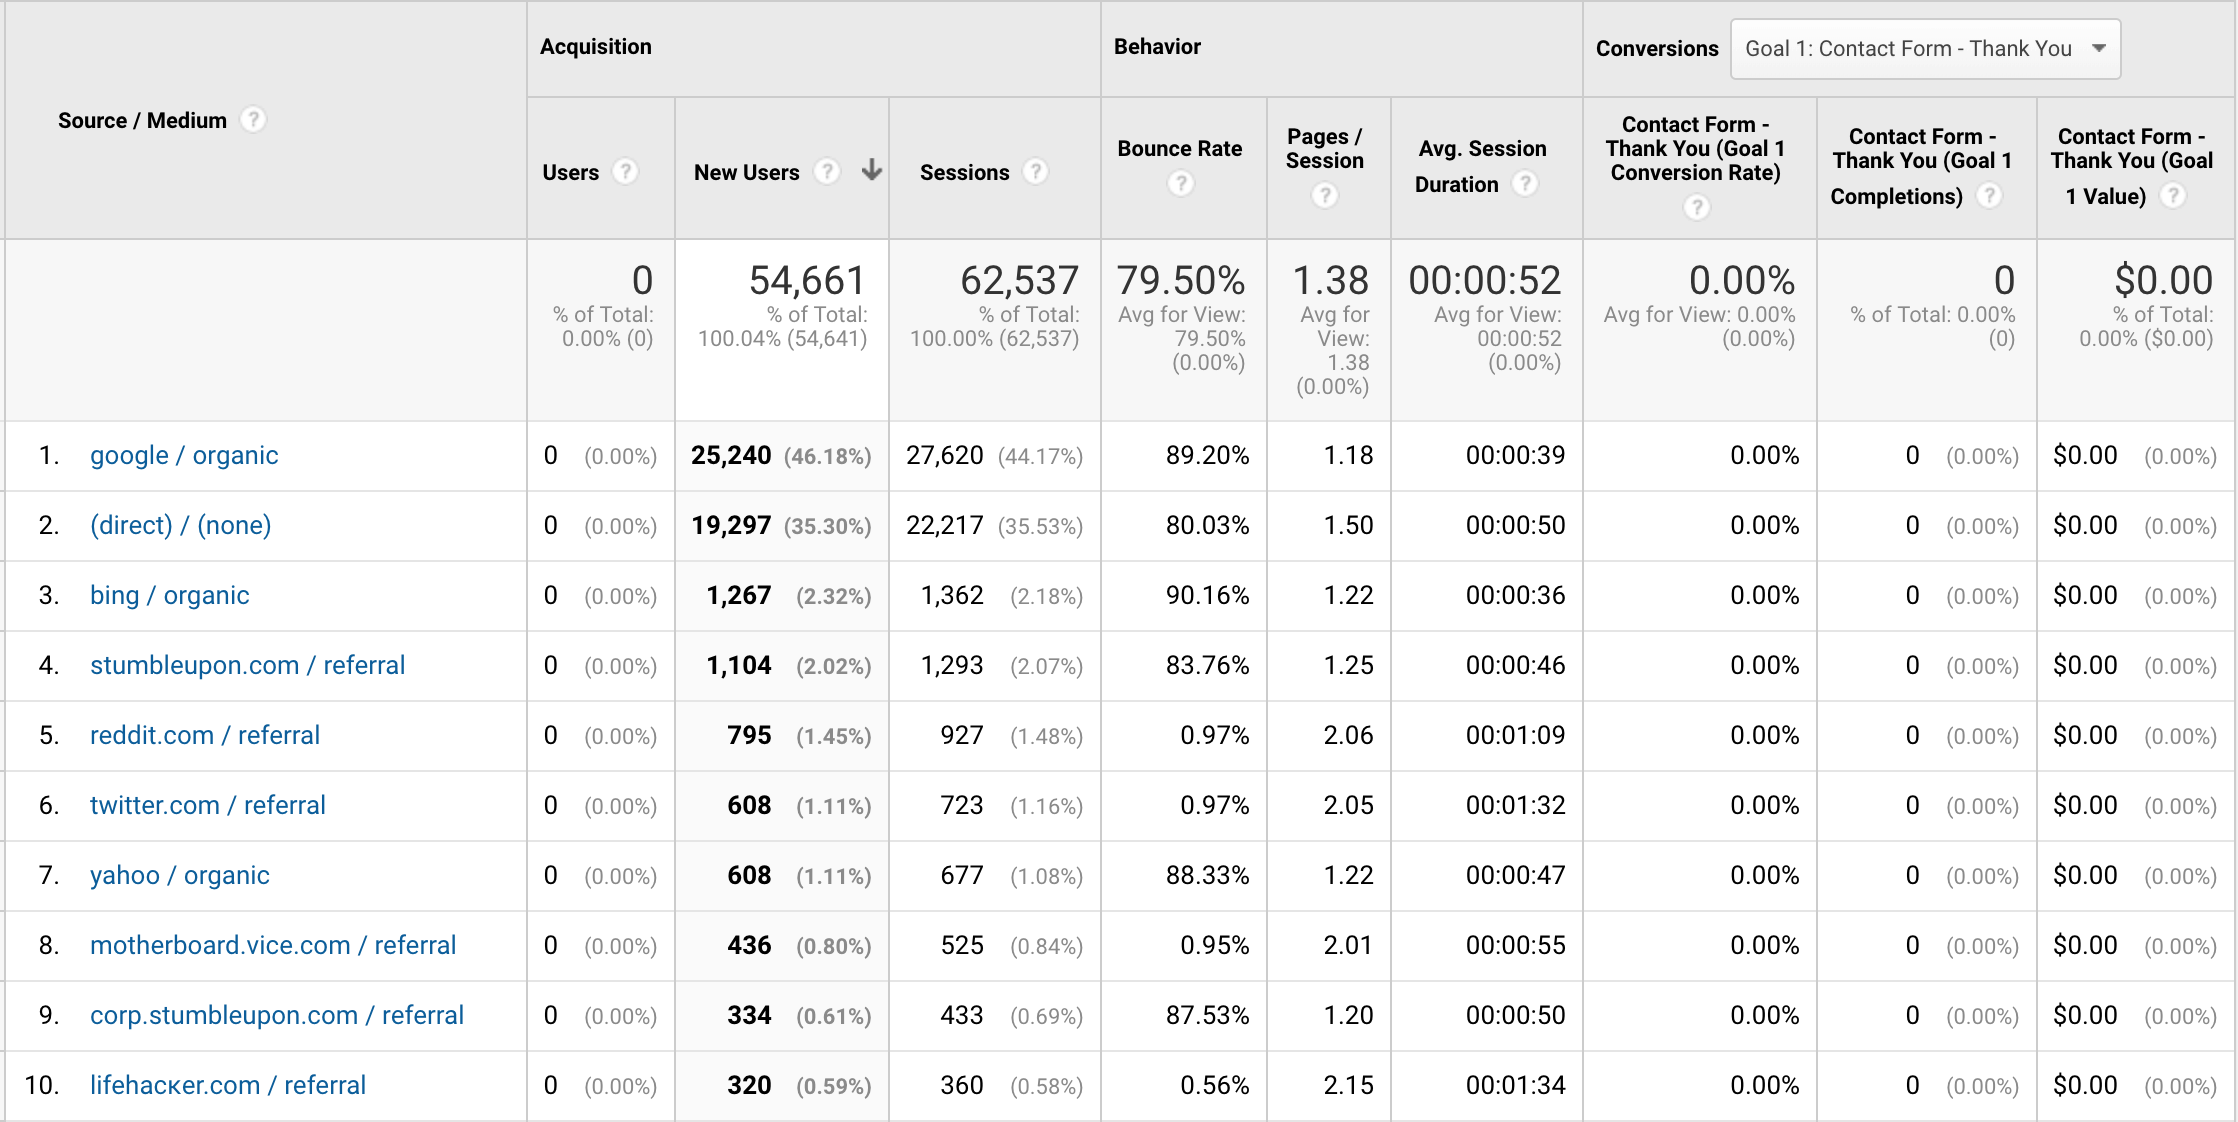
Acquisition > All Traffic > Channels
Get an overview of the top performing channels – organic search, paid traffic, direct traffic, referral traffic, social traffic, and email traffic.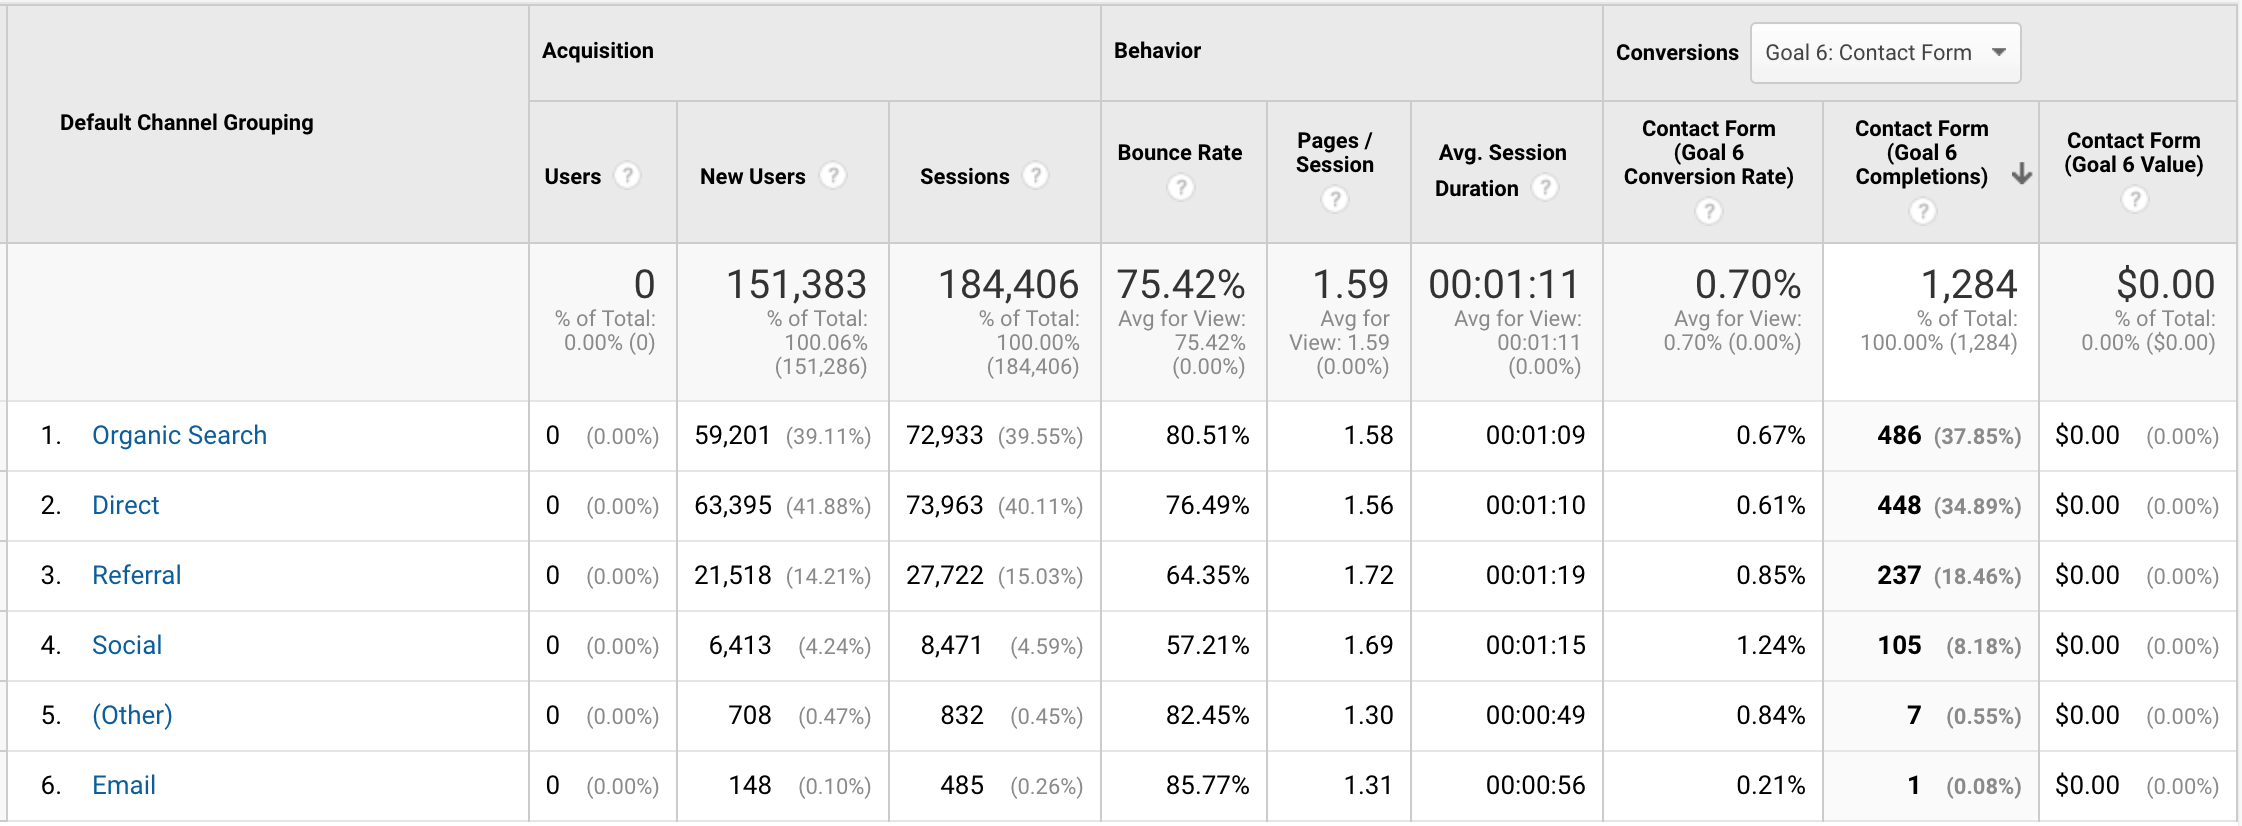 For additional details, including specific sources that help users discover your website or app, click through additional reports under the Acquisition menu, like the All Traffic > Source/Medium report and Social reports. These will reveal specific URLs and referral sources.
Behavior > Site Content > All Pages
Find out which pages receive the most traffic using the All Pages report. Review the Bounce Rate column for your top trafficked pages to determine if any are in need of improvements to ensure that more users spend more time on them and engage.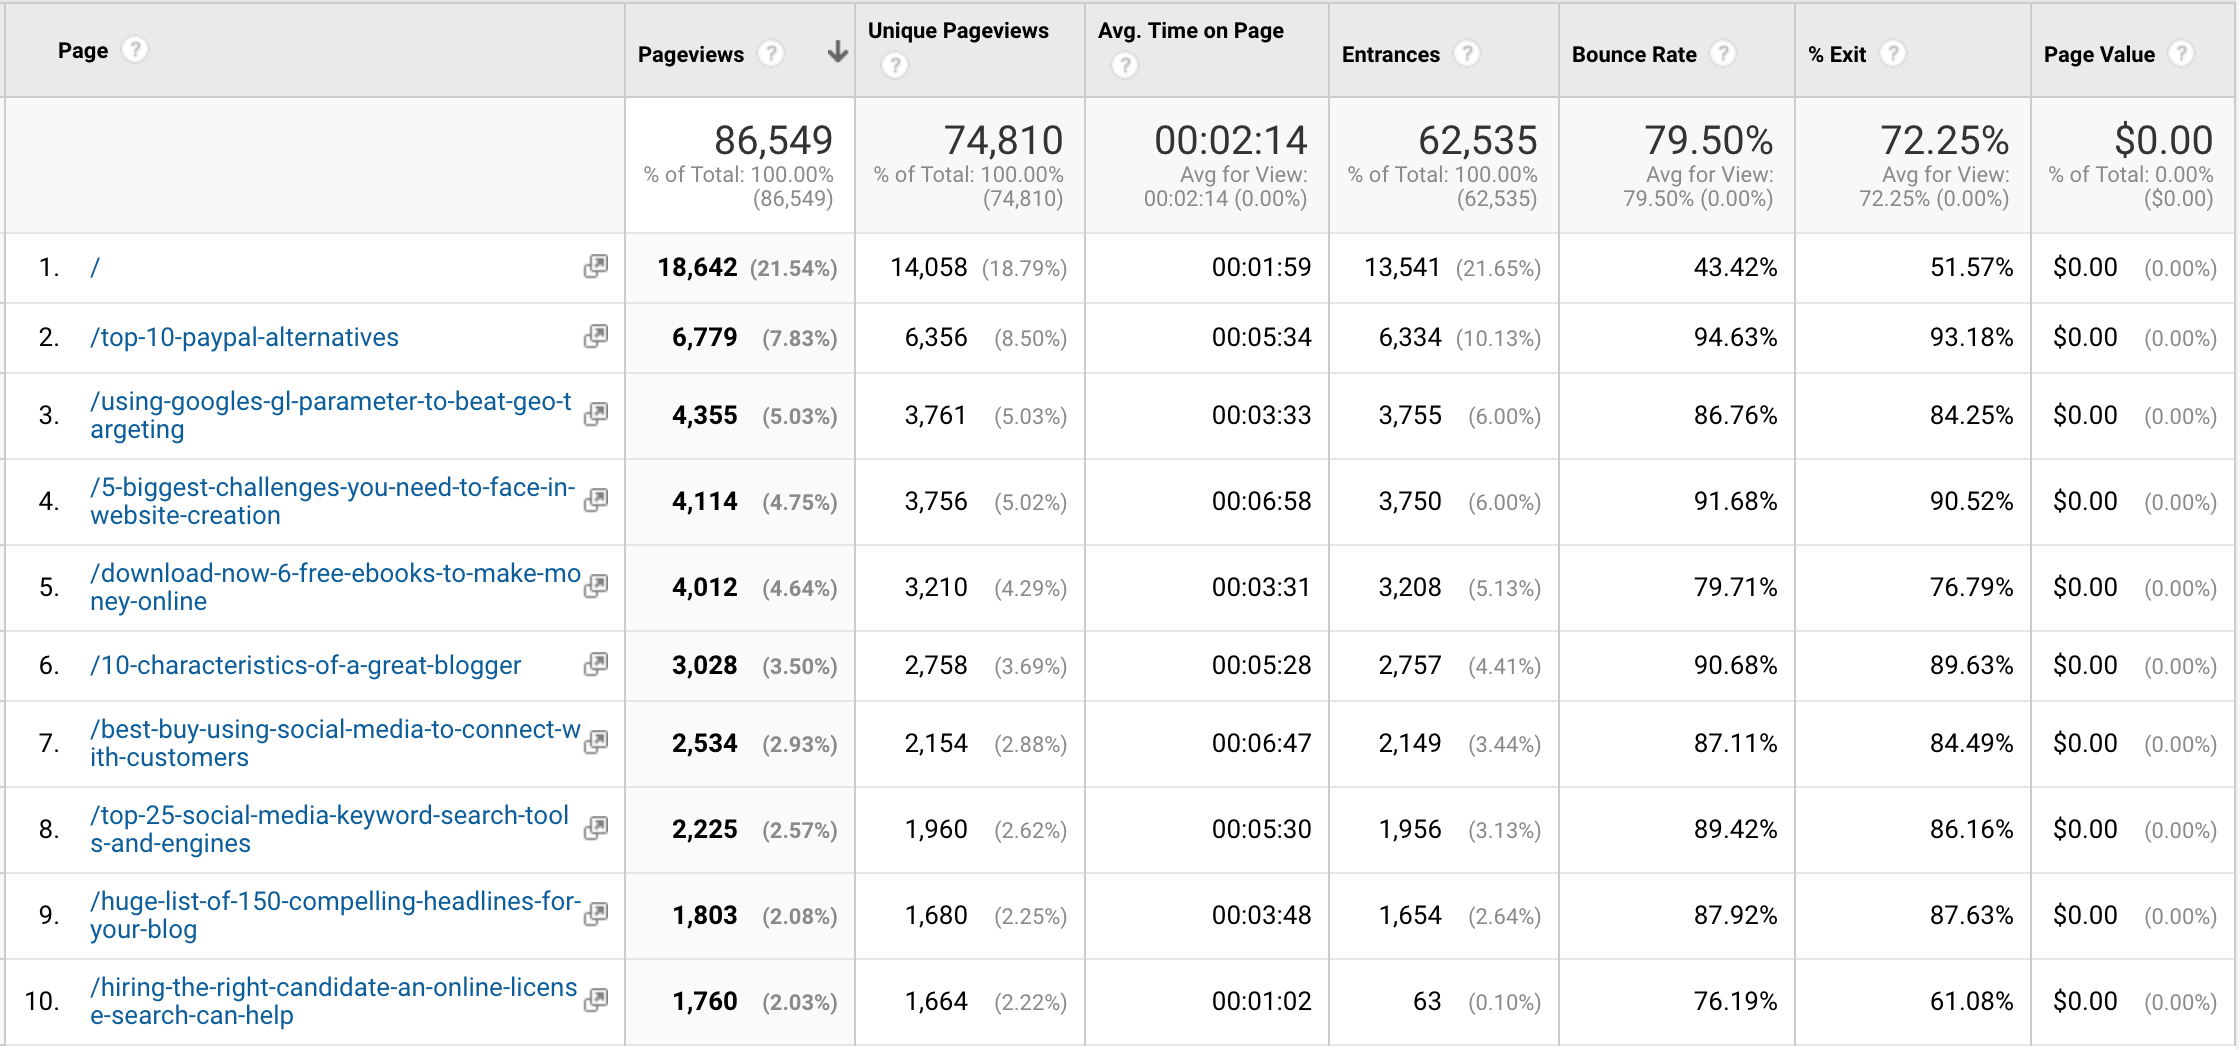
Behavior > Site Speed > Page Timings
The Page Timings report helps webmasters identify the slowest loading pages that users access most. Since page load speed can have an effect on conversions, it’s in your business’s best interest to find out what slows down your top pages.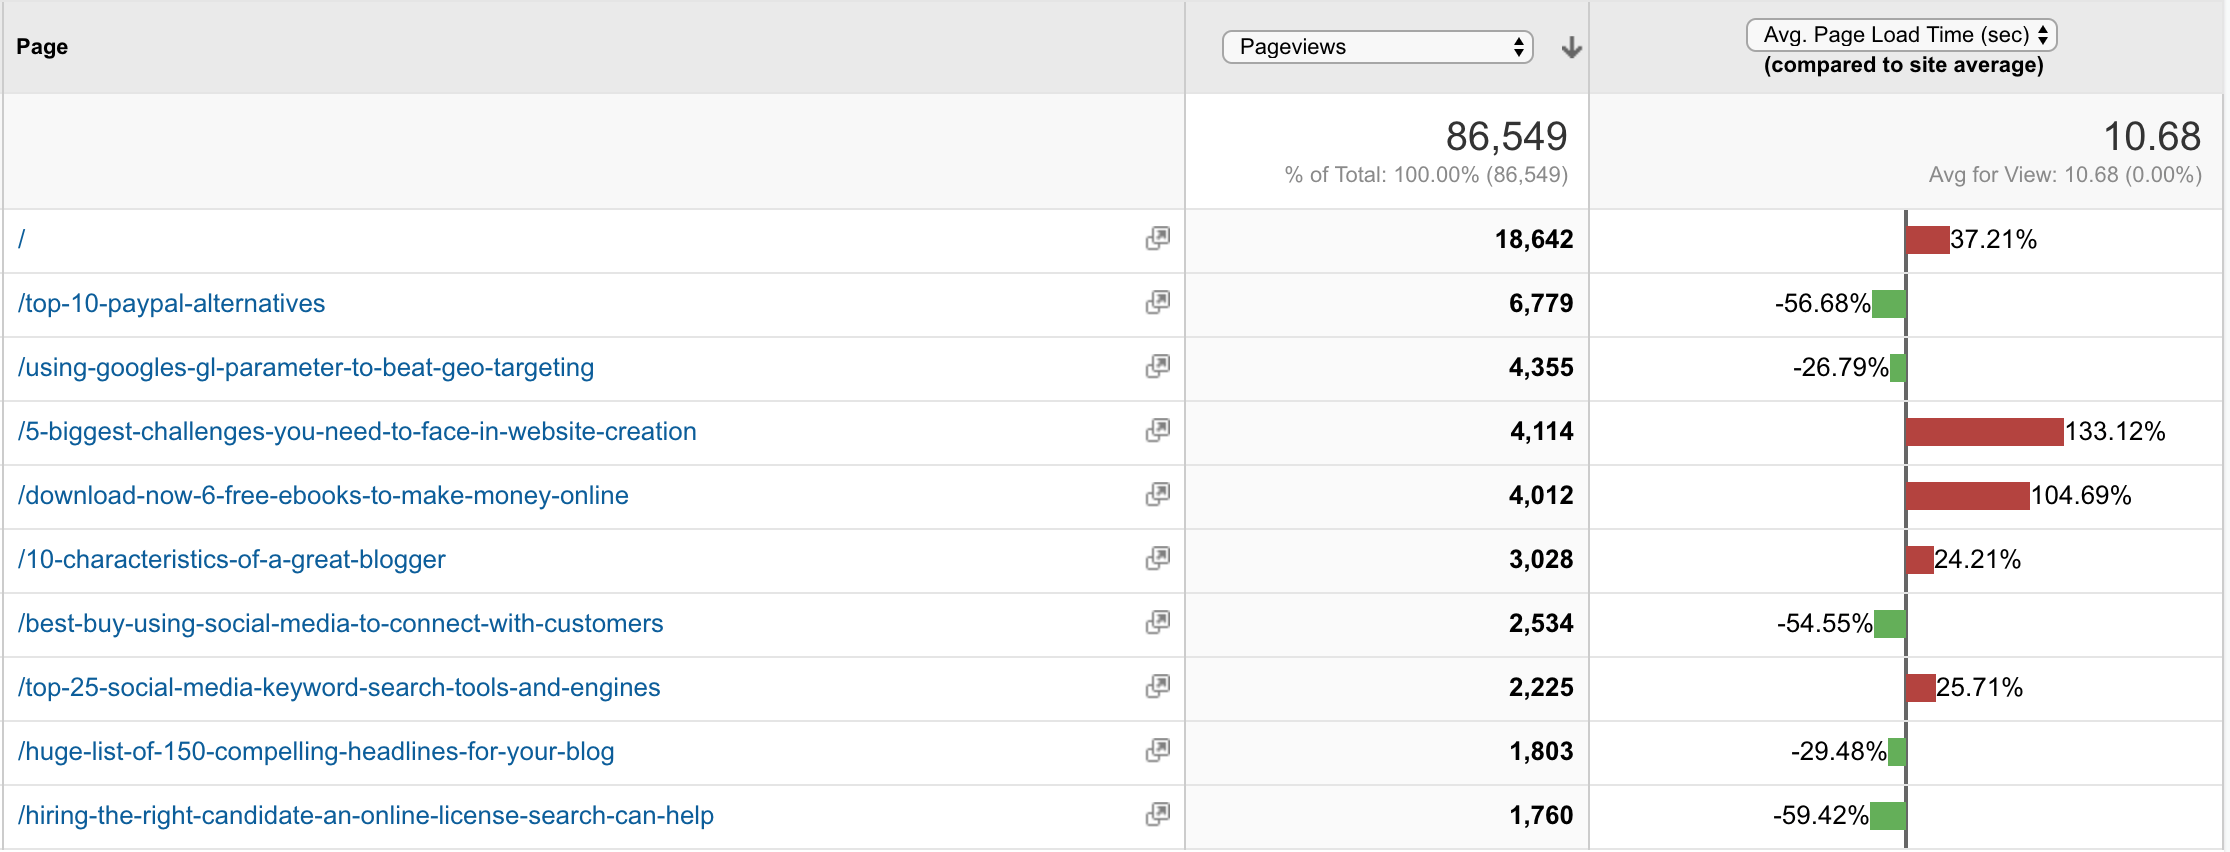
Conversions > Goals > Funnel Visualization
Most of the reports in the Conversions section are a goldmine for businesses looking to link revenue to specific marketing campaigns to determine ROI. The Funnel Visualization report, for example, will help you pinpoint areas within your sales funnel that need to be optimized for conversions. If you set up a Goal with a funnel, your Funnel Visualization report will eventually look something like this.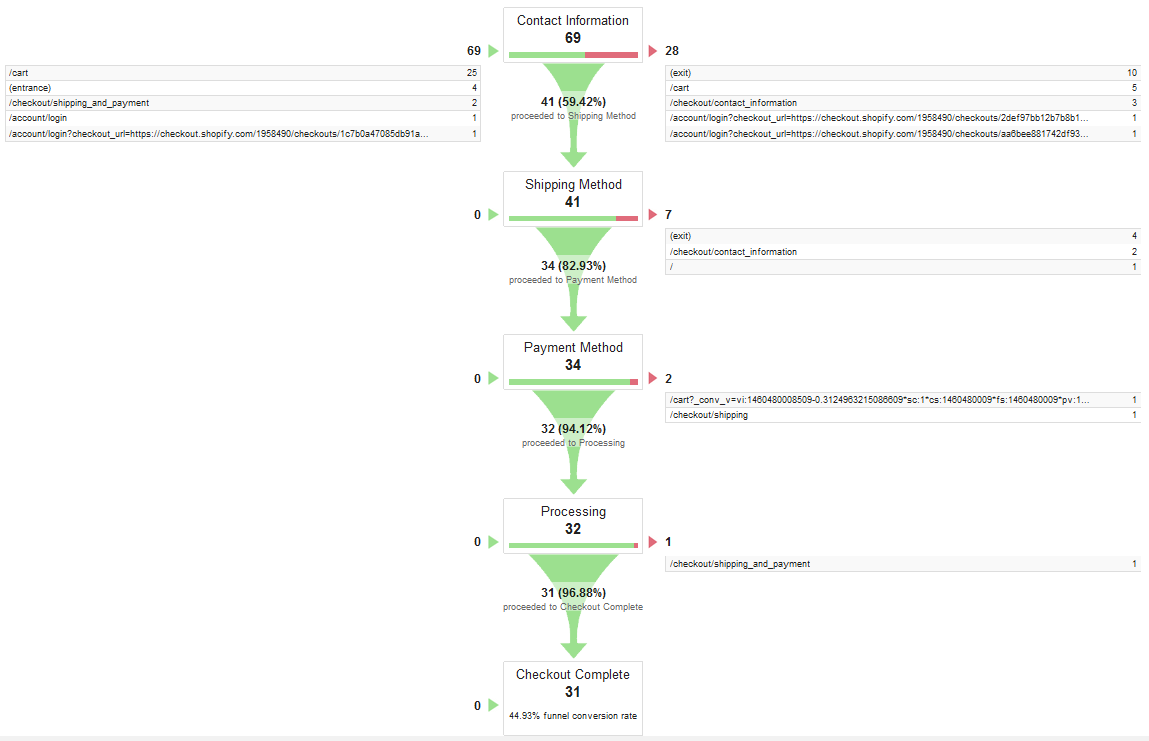 An ecommerce store owner could use this report to diagnose a conversion issue on their contact information page. Fixing it could lead to more sales in their online store.
Conversions > Multi-Funnel Channels > Top Paths
Not to be confused with the custom funnels you set up with your Goals, the Multi-Funnel Channel Top Conversion Paths report displays the path of a user from specific traffic channels like unpaid search results and social media before completing a Goal.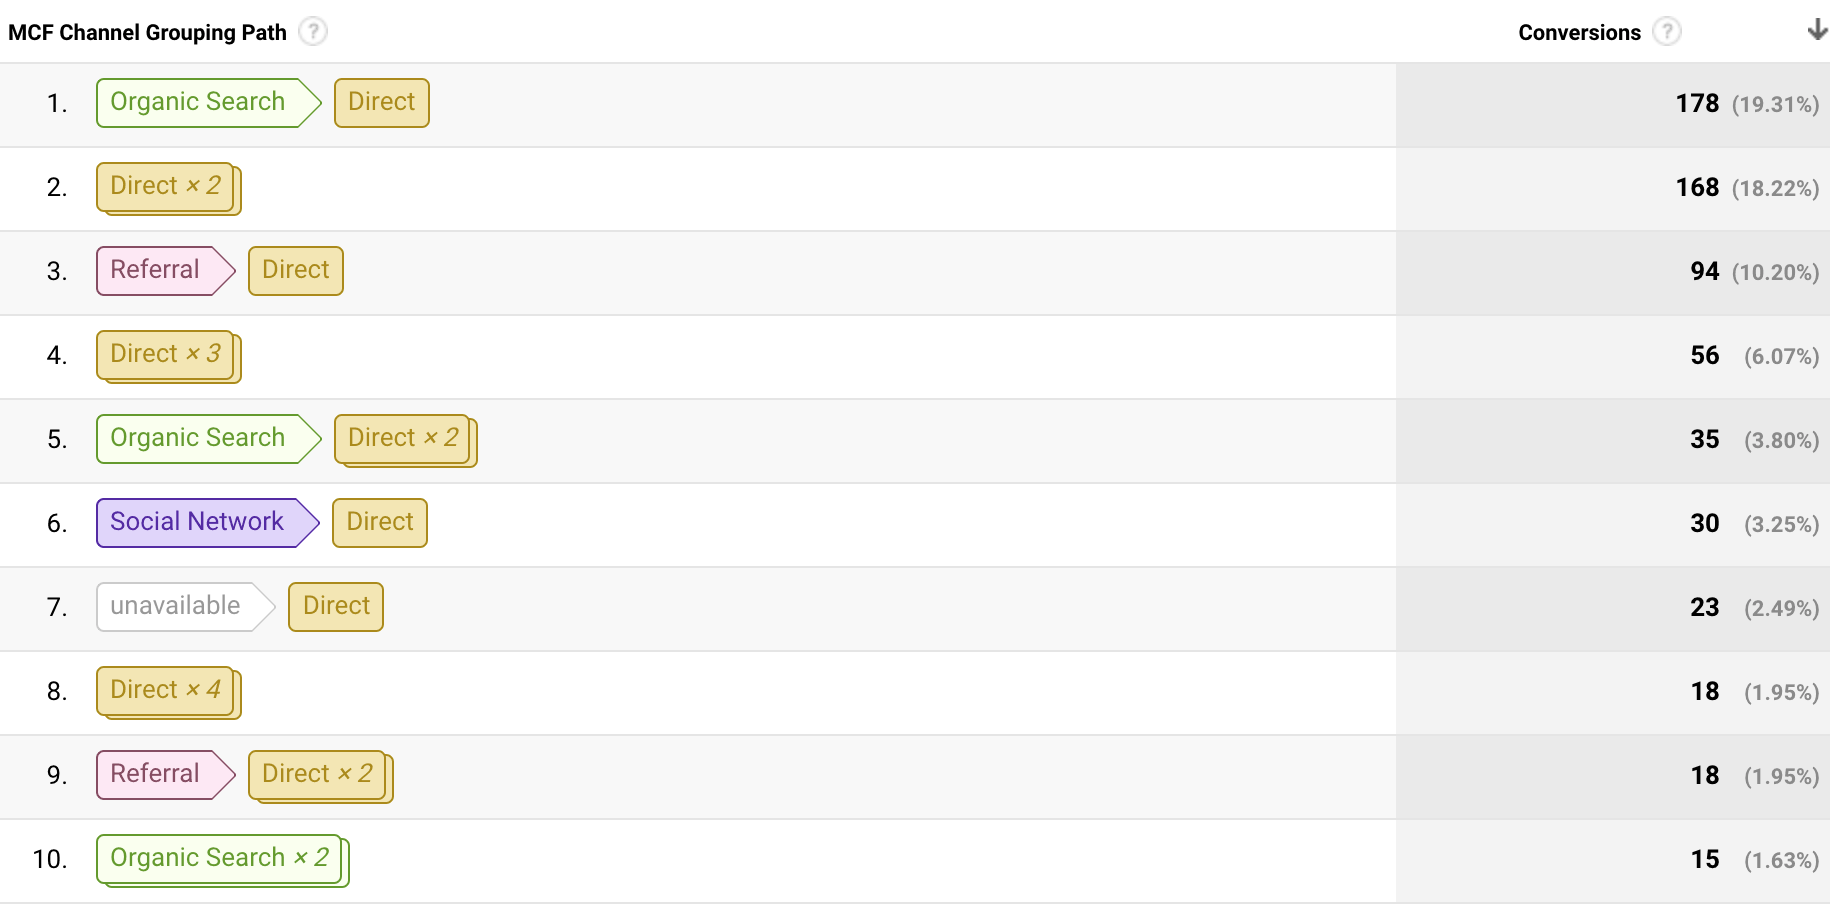 Here, you can see that the top traffic channel path that led to conversions was a user visiting from organic search and then directly before completing a Goal.
Using the Google Analytics 4 Dashboard
The Google Analytics 4 dashboard is entirely different from the old version and will take some extra learning to understand.
However, I think the new dashboard is actually a bit easier to navigate – even for total beginners.
![[Updates] Google Analytics for Beginners](https://dt2sdf0db8zob.cloudfront.net/wp-content/uploads/2020/11/-updates-google-analytics-for-beginners-1.png) As you can see, the new Google Analytics dashboard is focused much more on monetizing your website or app and understanding your customers.
I’ll quickly introduce you to the most critical changes and updates.
As you can see, the new Google Analytics dashboard is focused much more on monetizing your website or app and understanding your customers.
I’ll quickly introduce you to the most critical changes and updates.
Comparisons
Google Analytics 4 lets you create subsets of users immediately, based on different metrics like gender and age group. The Comparisons tool allows you to quickly create basic audience segments and understand different people interact with your website or app.![[Updates] Google Analytics for Beginners](https://dt2sdf0db8zob.cloudfront.net/wp-content/uploads/2020/11/-updates-google-analytics-for-beginners-2.png)
Acquisition
An improved overview of where your users are coming from and how they’re landing on your website. There’s a greater focus on Google Ads campaigns, so you can quickly get an idea about how effective your paid search ads campaigns are.![[Updates] Google Analytics for Beginners](https://dt2sdf0db8zob.cloudfront.net/wp-content/uploads/2020/11/-updates-google-analytics-for-beginners-3.png)
Engagement > Events
Events have replaced Goals for a much smoother (and code-free) way to track how users interact with your website. You can track specific events, such as clicks on certain important links, downloads, form submissions, video plays, and much more. You can also track various data points about specific events, once you’ve created them, to understand which are most effective – and profitable.![[Updates] Google Analytics for Beginners](https://dt2sdf0db8zob.cloudfront.net/wp-content/uploads/2020/11/-updates-google-analytics-for-beginners-4.png)
Monetization
If you’re building an e-commerce site or monetizing one through ads, Google Analytics 4’s Monetization section is going to be critical to your planning. It breaks down your property’s performance in terms of revenue earned and analyzes data, so you understand how you’re making money, your best-performing items, and much more. This helps you make small, quick changes that could significantly impact your income.![[Updates] Google Analytics for Beginners](https://dt2sdf0db8zob.cloudfront.net/wp-content/uploads/2020/11/-updates-google-analytics-for-beginners-5.png)
Insights Shortcuts
If you’re looking for a specific piece of data, but you don’t want to trawl through Google Analytics looking for it, use Insights. You can ask Google Analytics 4’s AI questions about how your website or app is performing, and it will provide the answer. You can also choose one of the template questions under headers like Basic Performance, Demographics, and Ecommerce to check the most commonly queried data points in each.![[Updates] Google Analytics for Beginners](https://dt2sdf0db8zob.cloudfront.net/wp-content/uploads/2020/11/-updates-google-analytics-for-beginners-6.png)
Retention
Returning users are the best way to build an audience (and recurring revenue). This section shows you who’s coming back to your website for repeat visits so that you can adjust your approach accordingly.![[Updates] Google Analytics for Beginners](https://dt2sdf0db8zob.cloudfront.net/wp-content/uploads/2020/11/-updates-google-analytics-for-beginners-7.png)
Going Beyond the Basics
As you get used to the standard Google Analytics reporting features, you can start to dive into the more advanced features, including the following.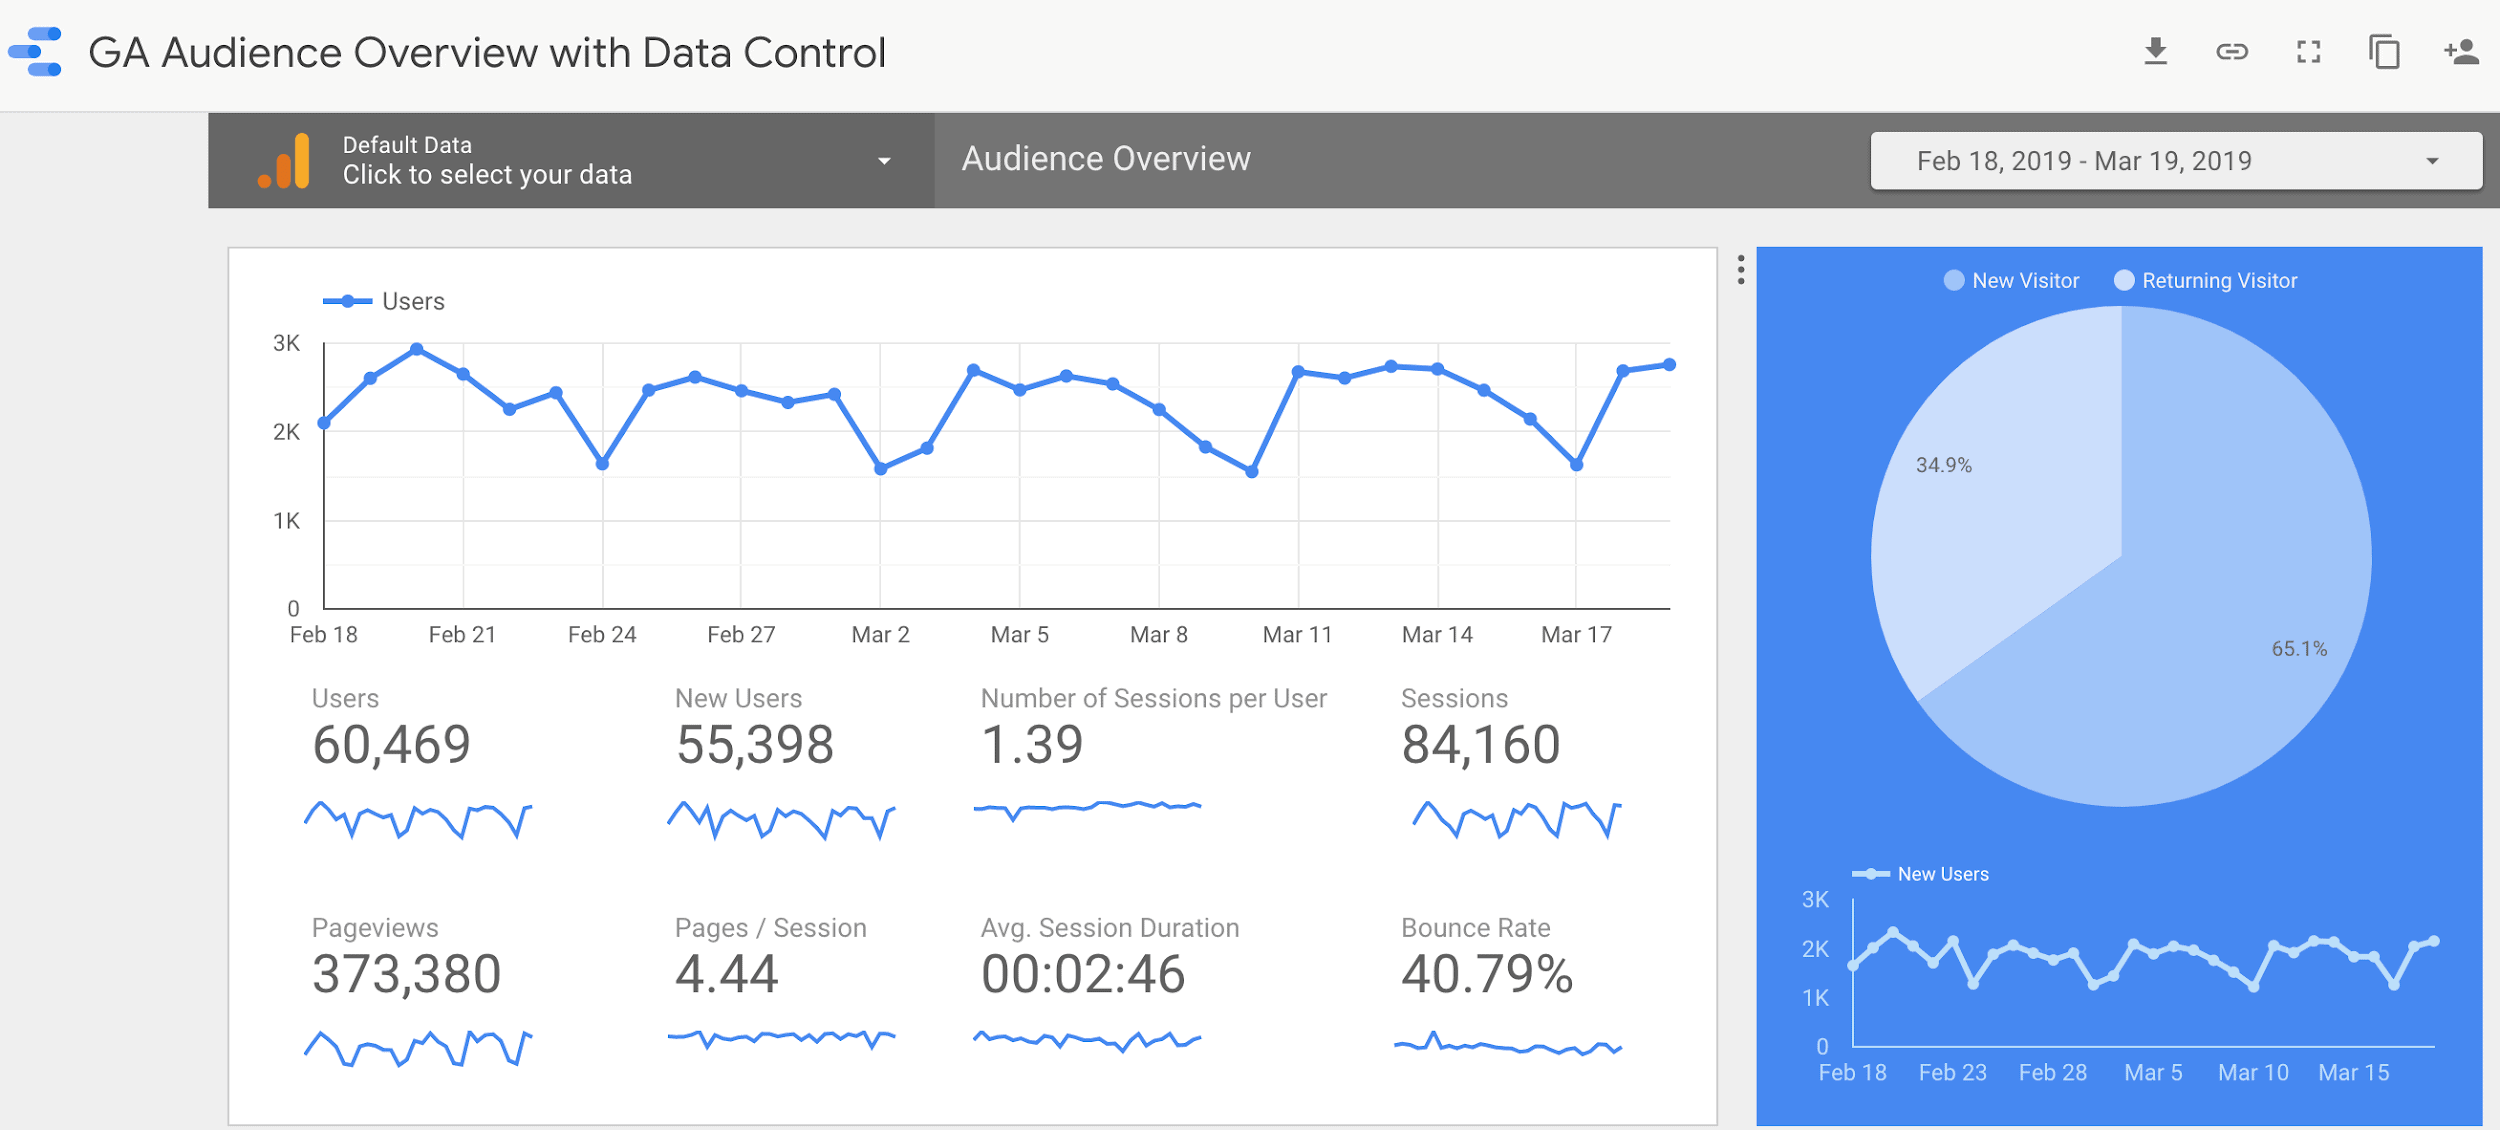
- Create Segments to see every piece of your Google Analytics report data for a particular group of users, like users from a certain country or paid traffic source.
- Create Custom Reports that show the data you really want in one report. Think of it as making a standard Google Analytics report more relevant to your business.
- Create better visualizations of your Google Analytics data using Data Studio (as shown above).
- Customer Lifecycle reports help you understand the journey(s) your users and customers take after they’ve visited your website or app for the first time. With this information, you can make big changes that increase traffic and revenue.
- Insights and Predictions, driven by AI, predict market trends, etc. using GA
- Event Tracking, see the impact on your analytics any time someone takes an action on your site, you introduce a new feature, publish a blog post, much more.
Google Analytics 4 Updates
In 2020, Google released Google Analytics 4. The latest update of the platform represents a massive shift in how Google Analytics will help website owners and marketers in the future. Google Analytics is moving away from cookies-based data analytics and taking a more customer-focused approach, with the help of AI and machine learning. Most of the new features are for advanced users. But even beginners will benefit from understanding how they work and the value they provide.![[Updates] Google Analytics for Beginners](https://dt2sdf0db8zob.cloudfront.net/wp-content/uploads/2020/11/-updates-google-analytics-for-beginners-8.png)
- Predictive models and trends: By analyzing your current and past data, along with trends in your market or niche, Google Analytics 4 can predict changes in your data and user behavior. This will help you plan ahead and make better decisions.
- Cross-device tracking: You can now track individual users across multiple devices. So if someone first visits your e-commerce site on their laptop, but returns to make a purchase on their phone or tablet, you can see the entire journey in one place.
- Better integration with Google Ads: You’ll be able to market your products or content more efficiently with the help of Google Analytics.
- Better data controls: To ensure you’re complying with GDPR, CCPA, and other data privacy regulations.
- More customer-focused tools: In the future, Google Analytics will move from providing ‘raw’ data to providing marketers with a full suite of marketing tools focused on how humans interact with their website properties.
In Conclusion
In terms of Google Analytics features, this post is only the tip of the iceberg. Once you have mastered the basics, be sure to dive deeper into your website or app analytics, using the data to improve your website’s traffic and conversions.Content attribution: Website Planet is the sole owner of the visual and written content on this website. You are free to share our content and visuals on your site, but we ask that you provide a link back to the resource if you do, enabling us to continue providing authoritative reviews and guides to help individuals and businesses thrive online.