
Digital content publishers are always looking for ways to improve audience engagement, make informed editorial decisions, and increase readership. We spoke with Nalini Edwin, Director of Product Marketing at Chartbeat, about how their platform provides real-time analytics, insights, and transformative tools for content teams around the world, helping them build long-term audience loyalty.
This interview was originally published on May 14, 2020.
What is Chartbeat?
Chartbeat makes products that give you data and insights about your content and the tools to improve its performance. Specifically, we provide audience-loyalty and traffic analytics, experience optimization tools, and clickstream data pipelines to content teams around the world.
Our customer base is primarily media and publishing organizations, and we work with thousands of media brands across 70+ countries, including The Atlantic, The New York Times, CNN, The Washington Post, Le Monde, and The Telegraph. But our platform is also used by content teams in many other sectors, from nonprofits to finance. They all rely on Chartbeat to track the engagement, loyalty, and reach of their audience and to grow the impact of what they create.
How do different roles use Chartbeat, and how do your tools work for them to deliver efficiency and effectiveness?
The ease of use, speed, and flexibility of our tools are the primary drivers of efficiency and effectiveness across the board. Some examples:
- Editorial and production teams use Chartbeat’s analytics and optimization tools to understand what topics are resonating with their audience both in the moment and over time. This helps them:
- Plan daily, weekly, monthly, and annual lineups
- Allocate production resources efficiently across sections and authors
- Enhance onsite UX and troubleshoot where needed
- Test and experiment to optimize for onsite engagement, particularly on homepages and landing pages
- Audience Development teams use us to understand the drivers of visitor frequency and loyalty, as well as what segments to cultivate further (and which tactics to use)
- Social and Community teams use us to discover new communities, engage them appropriately for each platform with content and conversation, and stay on top of social chatter as a driver of referral traffic onsite.
- Marketing, product, and data science teams use our pipeline for clickstream analysis, allowing them to accomplish things like:
- Targeted marketing
- Multi-touch attribution
- Customer segmentation
- Registration, subscription, and churn prediction
- Lifetime value analysis
- Powering internal dashboards
- Algorithm and feature research
How can your Real-Time Dashboard help users understand how their audience is connecting with their content?
Our Real-Time Dashboard helps you find and understand your readers by monitoring and tracking patterns in traffic and loyalty. It answers two essential questions: How is your audience getting to your content at the moment, across the universe of channels, platforms, and devices — and how much are they connecting with that content?
Armed with that information, teams can adjust their production, promotion, and optimization decisions to align with the actual behavior of their audience.
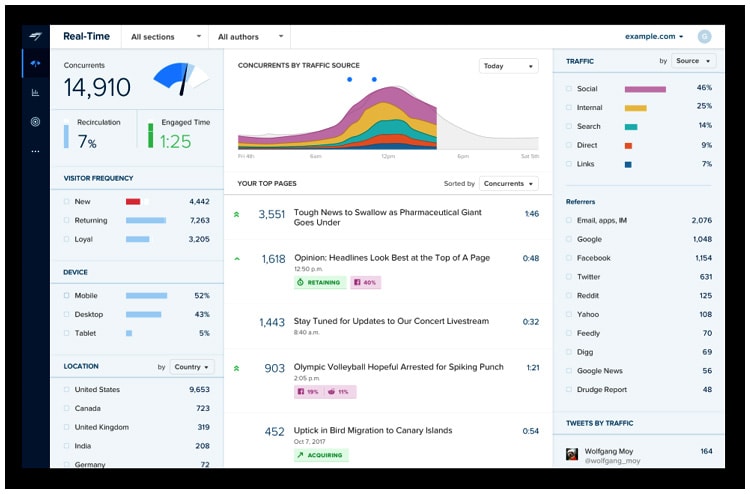
Because online readers move so quickly, and the online content ecosystem is vast, the dashboard has a ton of flexibility. You can:
- Toggle instantly between data that’s sitewide and data that’s article-specific
- Filter data by location, device type, traffic source and referrer
- Zero in on all content from a specific section or author
- Slice traffic between properties, to compare onsite audience vs. native app(s)
- Monitor offsite social conversations through Facebook’s CrowdTangle
- Segment data by visitor frequency and subscriber and/or registration status
- Integrate with Facebook Instant Articles and Google AMP
Can you measure engagement for video content?
We have a video-specific dashboard that helps users quickly gauge how much attention viewers are paying to video content. It primarily helps teams pinpoint the ideal distribution opportunities for video, but customers also use it to:
- Optimize video placement (we auto-generate recommendations)
- Monitor topline video metrics by integrating it with the Real-Time Dashboard
- Compare metrics like starts, play rate, engagement, and ad drop-off at the site and article level
- Analyze video performance over time by querying the data, which we store for you
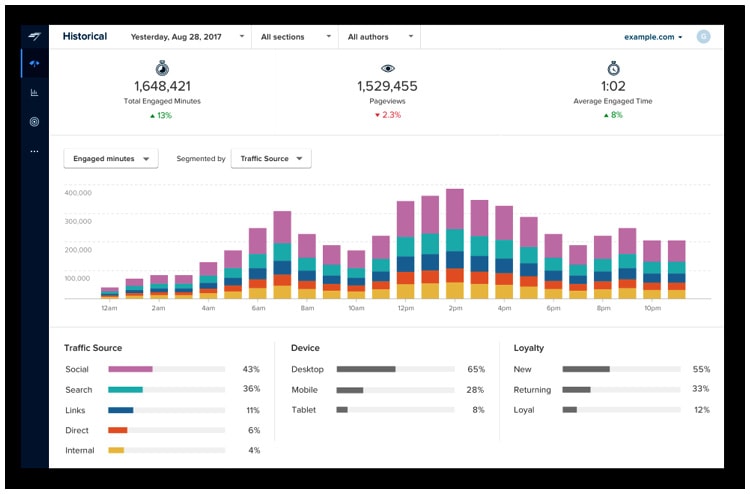
How can success and trends be evaluated over time?
There are several ways to evaluate success and trends over time. One of the quickest ways is through our Historical Dashboard, which tracks content performance, KPIs, and valuable trends over the long term. The dashboard is incredibly fast and easy to use, allowing users to:
- Filter by custom date range, section, and author
- Compare Total Engaged Minutes, Pageviews, and Average Engaged Time for sites and articles
- View trends and benchmarks, which we visualize with an eye to being instantly intelligible and useful to users
The data can be exported as well.
We offer a suite of email reports so users can see the previous day’s trends at a site, section, or author-specific level, which helps teams make strategic decisions that are still aligned with current news cycles. For those who want more advanced reporting and analysis, we have a tool that allows you to build your own queries.
Does Chartbeat integrate with native apps to extract additional data?
Yes. For many of our customers, native apps are a core way readers can access and consume their content. Our data studies also show that app readers tend to be a brand’s most loyal consumers of content, so they’re a key segment for our customers to cultivate.
Chartbeat offers integrations for native apps that pull app traffic into our Real-Time Dashboard. We also store that data, and if you use our Advanced Queries tool, you can see how your app content performs over time.
Customers use our integrations to:
- Get an instant-read on audience size
- Find content that engages app readers
- Compare engagement and loyalty metrics for native and web audiences
- Actively curate content and develop strategies for the app audience
- Improve the effectiveness of push notifications
- See traffic breakdowns across iOS and Android
What optimization tools are available?
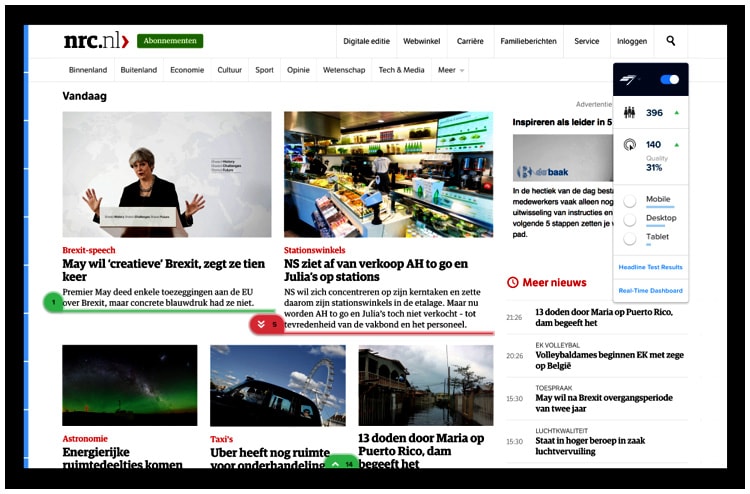
In a sense, everything Chartbeat offers can be thought of as an optimization tool as we aim to help content creators get the most out of every story. Two of our tools are particularly actionable for customers because of their real-time speed and ease of use.
Heads Up Display, our tool for optimizing content performance within your homepage layout, helps users quickly see which homepage articles are top-performing, how stories are trending up or down in traffic, and how far visitors are scrolling down the page. Having access to this data, laid over your live site experience, helps you adapt layout and reader experience to dovetail with readership patterns – and instantly see results. In addition, the Heads Up Display lets you:
- Compare clickthrough rate to post-click engagement for every link on a page
- Filter by mobile, tablet, or desktop to make segment-specific decisions
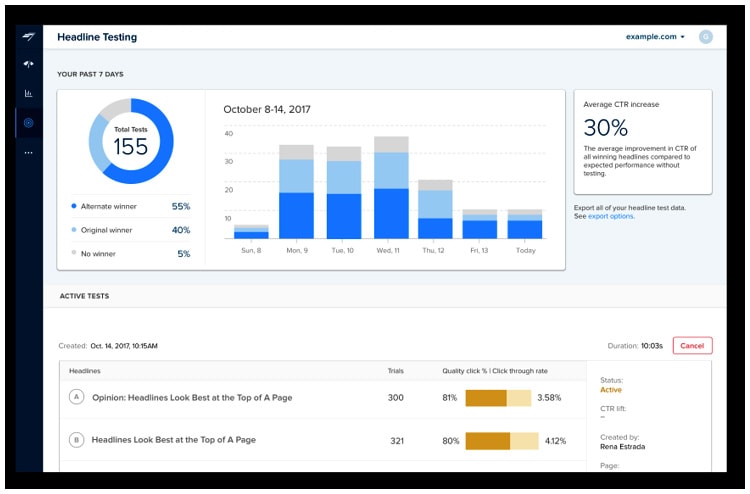
Our Headline Testing tool takes things a step further and uniquely so: unlike other tools in the market, it focuses on engagement, not clicks. Its goal is to bring an engaged readership to each story by optimizing for how long someone stays engaged on an article page after clicking on its headline. With this tool, you can maximize each story’s readership by attaching it to a headline proven to engage readers. Since the tool allows for dynamic tracking and integrates with the Heads Up Display, you can continue testing headlines even as an article moves to different positions on your homepage. You can also:
- Easily view and sort conclusive results from testing, via a dashboard of test results
- Export test data for further analysis of successful variants
What type of analysis does Chartbeat run, and how customizable are those reports?
With email reports, we can deliver customers a daily analysis straight to their inbox. All Chartbeat Reports contain unique auto-generated insights, built by Chartbeat data scientists and aimed at helping you identify unique and noteworthy patterns and trends in audience data. And they integrate with the Historical Dashboard to aid quick lookback analysis when you’re making content decisions in a pinch.
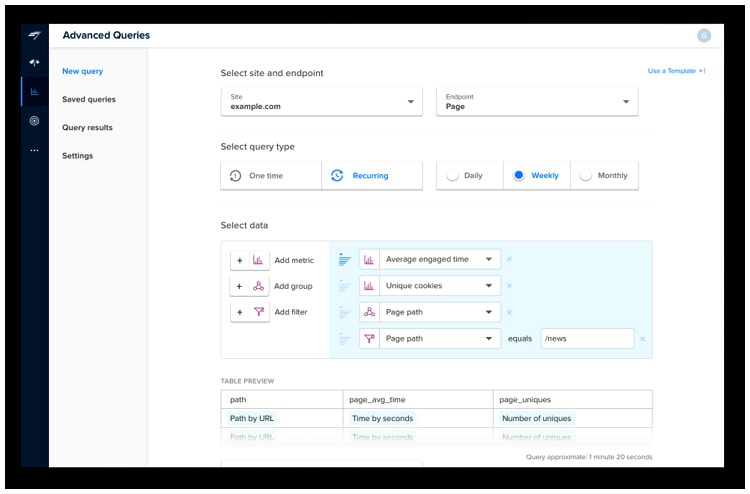
If a customer is looking for a more in-depth look at data, they can easily build what they need with our Advanced Queries tool which allows users to:
- See all metrics and filters from Chartbeat tools
- Set up one-time and recurring reports, for yourself or colleagues
- Download CSV results or stream data via API for use in other applications
How do Chartbeat customers see ROI from their data?
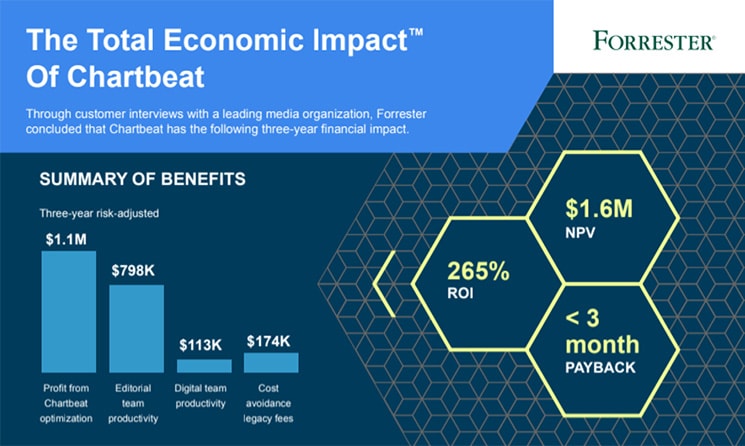
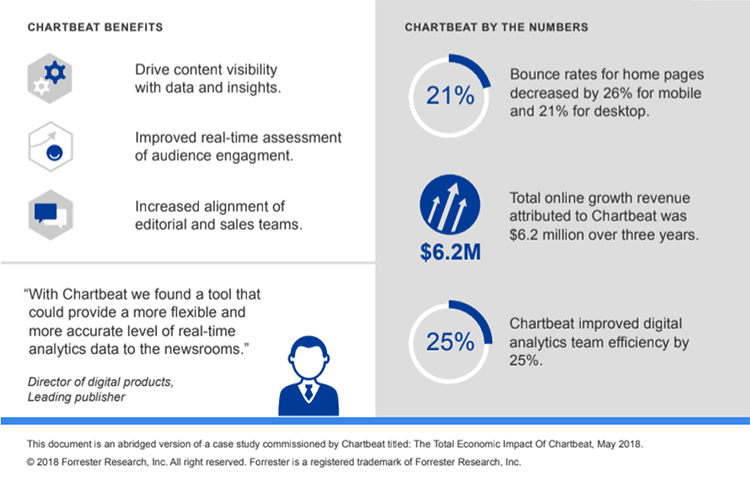
We enable a diverse set of use cases, but to use examples from the infographic below, the primary ways in which customers like this one see overall financial ROI is:
- $1.1 million in profit from Chartbeat optimization over three years
- $1.6 million in NPV
- Total online growth revenue attributed to Chartbeat was $6.2 million over three years
- < 3-month payback on Chartbeat tools
This customer also saw efficiency and operational ROI across the board as well:
- Bounce rates for home pages decreased by 26% for mobile and 21% for desktop
- Digital analytics team efficiency improved by 25%
- A closer relationship with their readers
- Increased alignment of editorial and sales teams
- Improved real-time assessment of audience engagement
For Chartbeat optimization tools specifically, we’ve conducted our own research and have found that the ROI reveals itself instantly:
- Sites that use Headline Testing have almost a 15% lower bounce rate than those that do not
- Headline tests resulted in a 78% lift in traffic to articles
- Headline tests resulted in a 71% lift in readership, helping sites build their loyal audience
You can read more customer success stories on our website.