
From a single typo that erased $440 million in minutes to a software patch that bricked 8.5 million devices, some of the most impactful failures in tech history have started with the simplest mistakes. As dependence on cloud computing and internet-based services grows, these errors are becoming not just more frequent but far more costly.
Today, software is embedded in nearly every aspect of everyday life. It helps administer hospitals, keeps transportation networks running, and supports global financial markets. In such tightly hyperconnected systems, even a small mistake (like a misconfigured update or a mistyped command) can cascade across global networks with severe consequences, disrupting entire industries across the world.
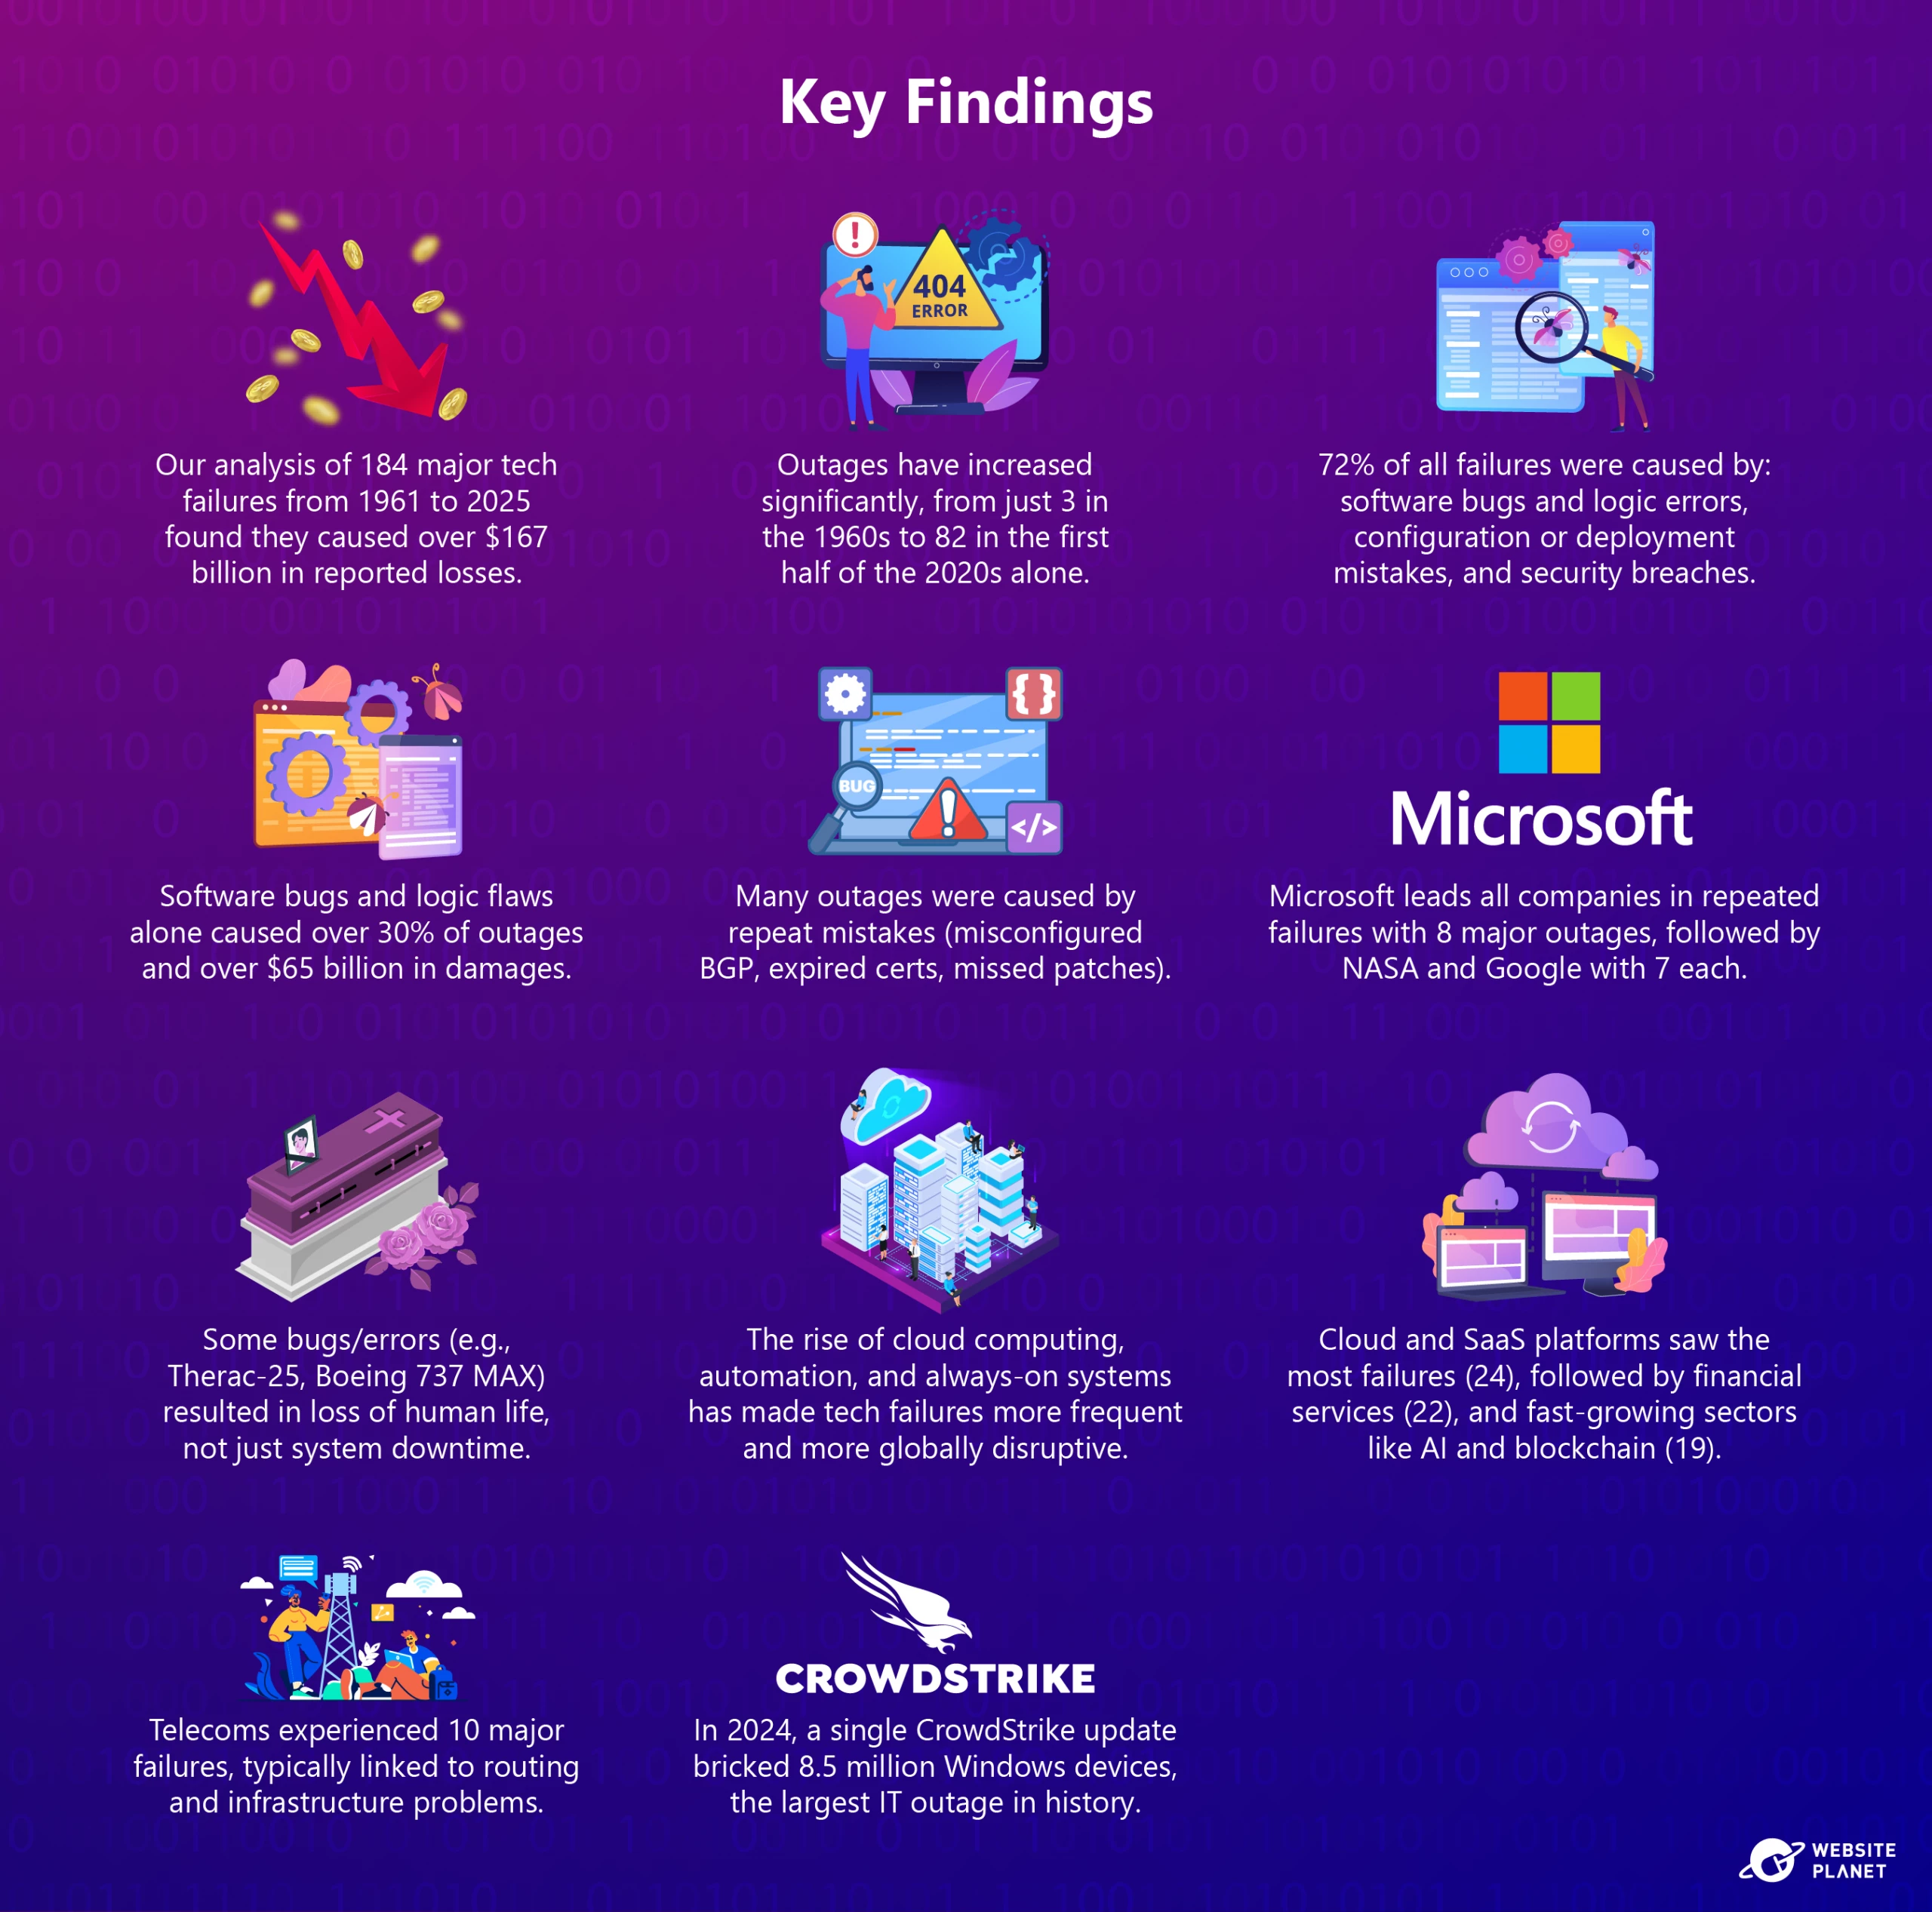
To understand the scale and cost of these failures, our research team at Website Planet analyzed 184 major tech failures between 1961 and 2025. This article explores six decades of global tech outage data to reveal the patterns behind these breakdowns — their root causes, common oversights, and the rising financial losses of simple errors.
The Anatomy of a Modern Tech Failure
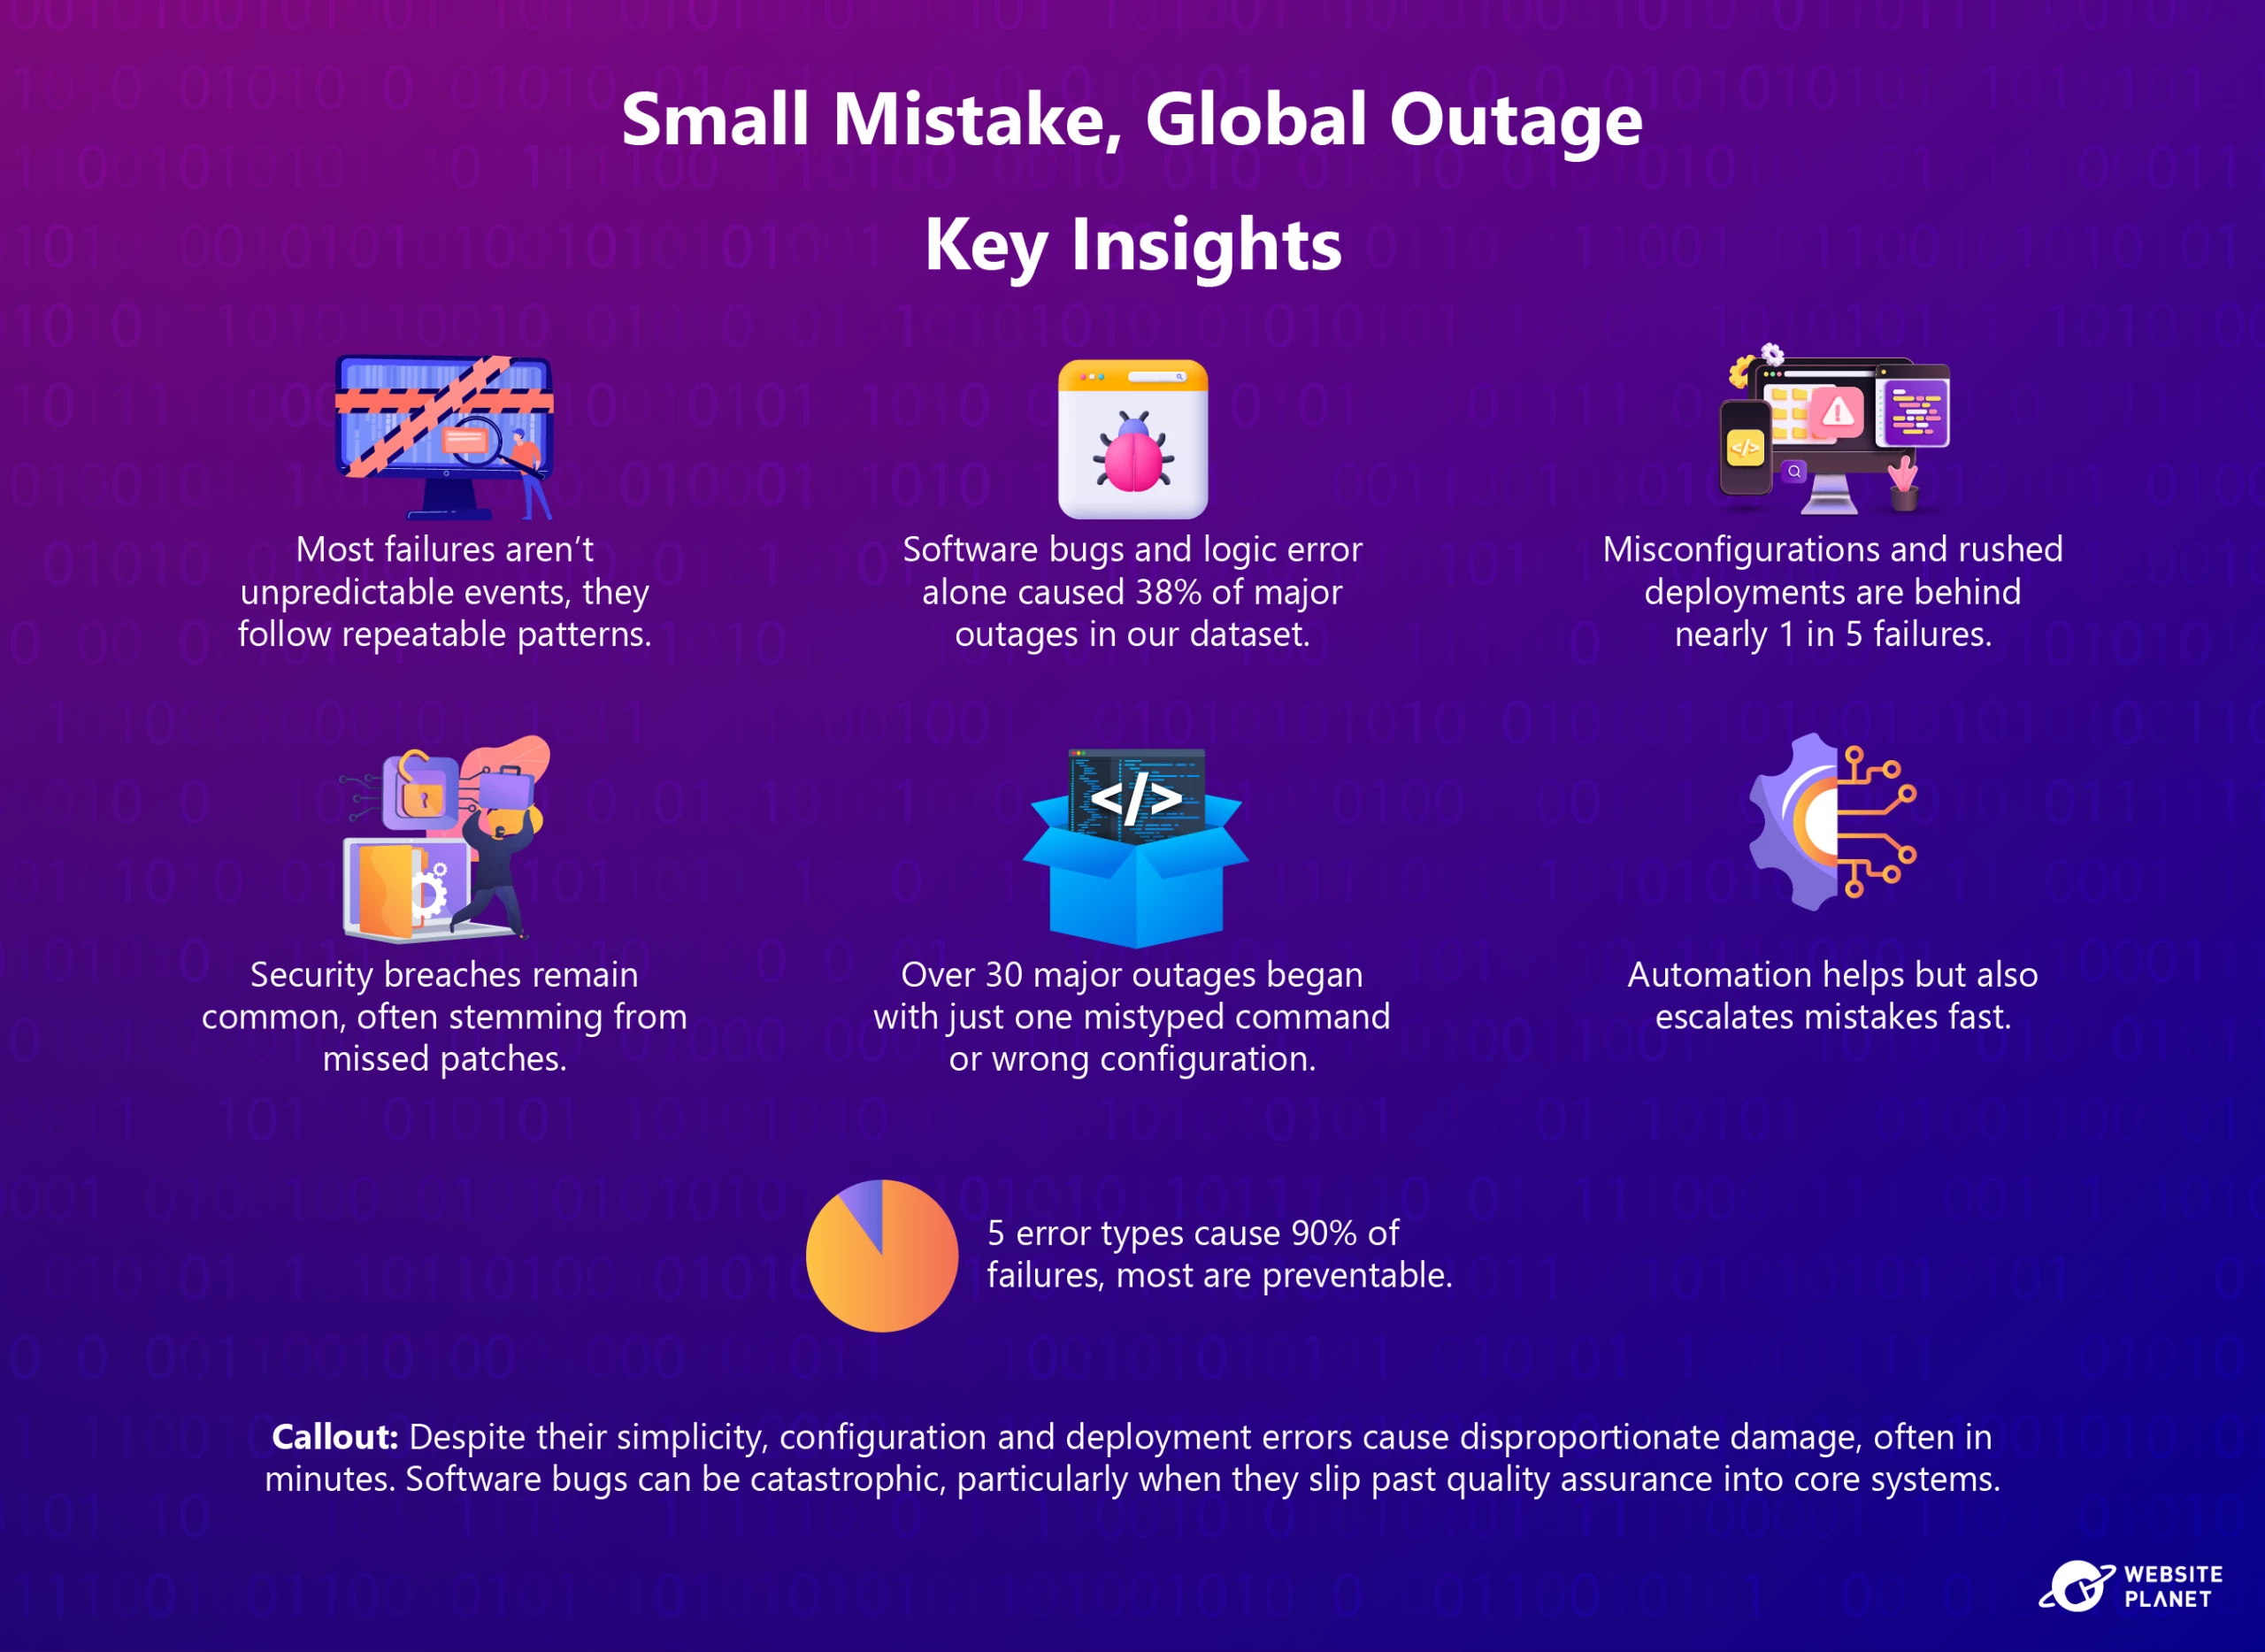
In our analysis, five root causes appeared most frequently, accounting for nearly 90% of all major outages: software bugs, security breaches, configuration issues, database errors, and infrastructure failures.
This suggests that most system collapses aren’t unpredictable incidents — they’re preventable errors.
Even though some failures, like security breaches and denial-of-service attacks, may seem out of an organization’s control, they typically occur because of existing vulnerabilities. By identifying and mitigating these weaknesses, organizations can prevent targeted attacks.
As you can see in the chart above, software bugs and logic errors (38%) are the leading cause for tech outages. These often escape Quality Assurance (QA) and enter into core systems, where even a faulty patch can cause major disruption. For instance, in 2024, a slight update from CrowdStrike bricked 8.5 million Windows machines — the largest IT outage witnessed so far.
Security breaches along with configuration and deployment errors together account for 34% of outages. Misconfigurations often consist of rushed updations, which may result in significant losses.
Back in 2021, for example, a misconfigured BGP (a routing protocol) update led to a disruption of Facebook’s services, resulting in users worldwide being unable to access the platform for about 6 hours.
Another notable case was the mistyped debugging command that triggered AWS’s 2017 S3 outage, taking down major sites and apps for hours.
Modern technology outages tend to follow certain patterns. This means that prevention often isn’t about advanced tools — it’s about getting the basics right, like applying security patches promptly, testing code thoroughly before deployment, or monitoring system limits and resource use.
In sum, failures can be avoided by catching small mistakes early, before they scale into global disruptions.
Trends Across Time: How Tech Failures Have Evolved
In the early years of computing, major technology outages were rare and mostly caused by basic software bugs and configuration issues. These were generally local hurdles, affecting only a few users or machines.
Since companies started shifting from on-premise to cloud infrastructure, and from manual to automated deployments, outages are not only more frequent but also far more disruptive.
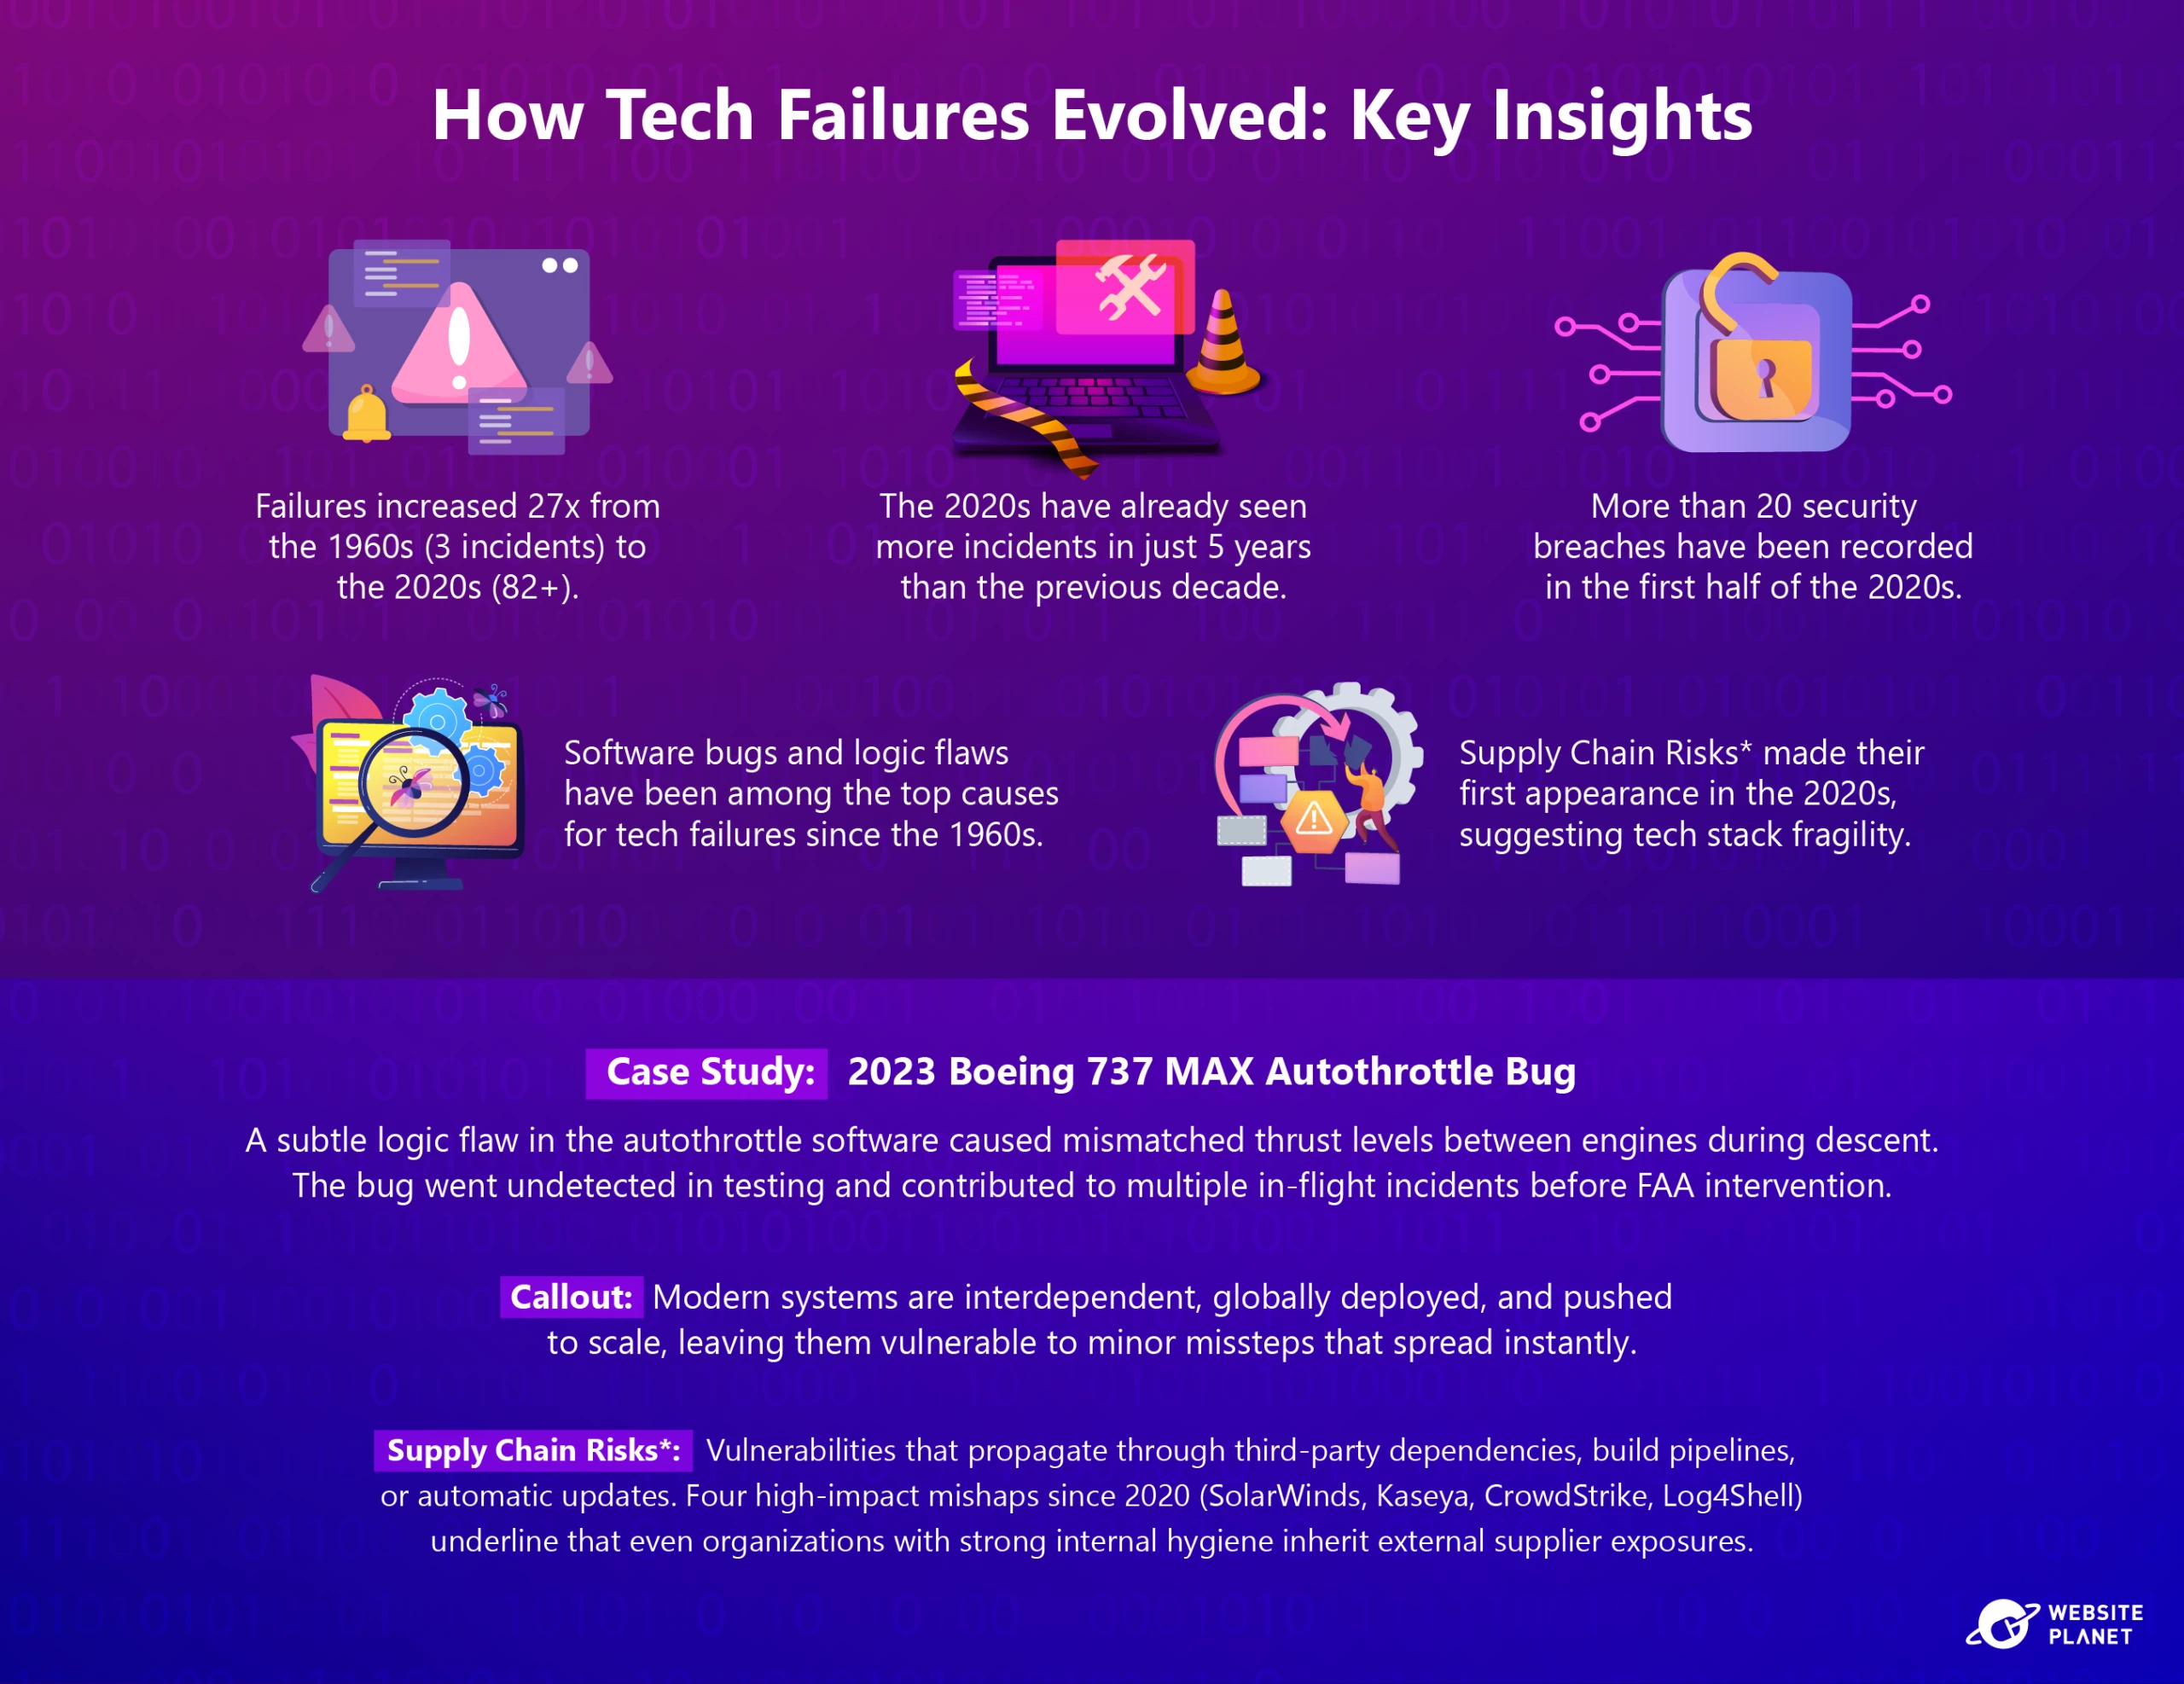
In the 1960s and 1970s, we found just a handful of notable outages (3 and 2, respectively). That number rose to 10 in the 1990s, a time when software usage was growing but hadn’t yet embedded itself into everyday life. By the 2010s, as digital systems became more popular among companies, the number of incidents jumped to 61.
Case in point, just in the first half of the 2020s, we tracked 82 major tech failures — that’s more outages than in the past two decades combined.
In the chart above, you can see a breakdown of the causes behind tech failures across the decades. Before the 1980s, the few major outages reported were due to resource exhaustion, configuration issues, and software bugs. As more incidents were recorded, new root causes emerged, such as infrastructure failures and denial-of-service (DoS) attacks.
Although it may seem like the occurrence of certain outage sources has decreased over the years, that’s not really the case. It’s just that the total number of tech failures within the same time frame has increased, so each individual cause now represents a smaller share of a much larger pool of failures.
Take, for instance, security breaches and cyberattacks. Back in the 1980s, these accounted for 50% of the 6 outages recorded; now, they are behind 24% of the 82 failures catalogued so far in the 2020s. So, the number of major tech outages prompted by security issues actually rose from 3 to 20.
This reflects not just an increase in threats, but a broader range of vulnerabilities, like exposed APIs and misconfigured cloud settings.
For example, in 2024, attackers exploited a 0-day vulnerability in Cisco’s IOS XE web interface, allowing remote code execution and persistent access to tens of thousands of network devices worldwide. This breach prompted emergency patches and urgent security advisories from governments.
In the modern world of hyper-connected systems and automated rollouts, a small misstep can trigger outages that could disrupt payment networks, government services, cloud platforms, and hospitals within minutes.
The 2025 Visa global outage is a prime example: A single misconfigured route reflector in a London data center rippled across the globe, halting 30,000 transactions per second.
Cost Breakdown by Error Type
Not all outages cause the same level of damages. Our analysis shows that the most expensive tech failures often come from hidden logic flaws in software rather than the everyday errors most QA teams are trained to catch.
Software bugs and logic errors account for over $65 billion in losses. These flaws often hide in systems that control critical functions (like autopilot controls or financial platforms) where a single logic mistake can lead to disaster.
For example, the Boeing 737 MAX crashes were caused by faulty control logic in the MCAS control system and cost over $20 billion in compensation, penalties, and lost sales.
Configuration and deployment errors, which are among the most frequent root causes of tech failures, have caused an estimated $32 billion in losses. These errors often spread through automated tools, where a single typo in a cloud deployment script can cause a nationwide outage in seconds.
In instances such as these, the impact of a tech failure does not necessarily depend on the duration of the outage, but on what fails and when. According to industry estimates, even short outages (under one hour) can cost companies $180 million, especially when they affect core systems like payment or healthcare during peak times.
A real-world example of this is the 40-minute IT failure at British Airways, which grounded hundreds of flights and disrupted travel for over 75,000 passengers in 2017.
Moreover, security incidents are becoming more frequent and causing increasingly bigger damages. So far, we’ve estimated a cumulative $29.4 billion in losses from the 38 incidents considered in our dataset. However, a few of those have been significantly costlier than others.
Take Equifax, for example — a missed patch led to the theft of 147 million personal records in 2017. Beyond immediate remediation costs, lawsuits and regulatory fines raised total losses to an estimated $10 billion.
Why Outages Reoccur in Certain Industries
Some companies and sectors appear repeatedly in our analysis. These aren’t isolated incidents — they point to a deeper systemic challenge in managing complexity, automation, and scale.
The data reveals that a small group of large technology institutions account for a disproportionate number of major failures.
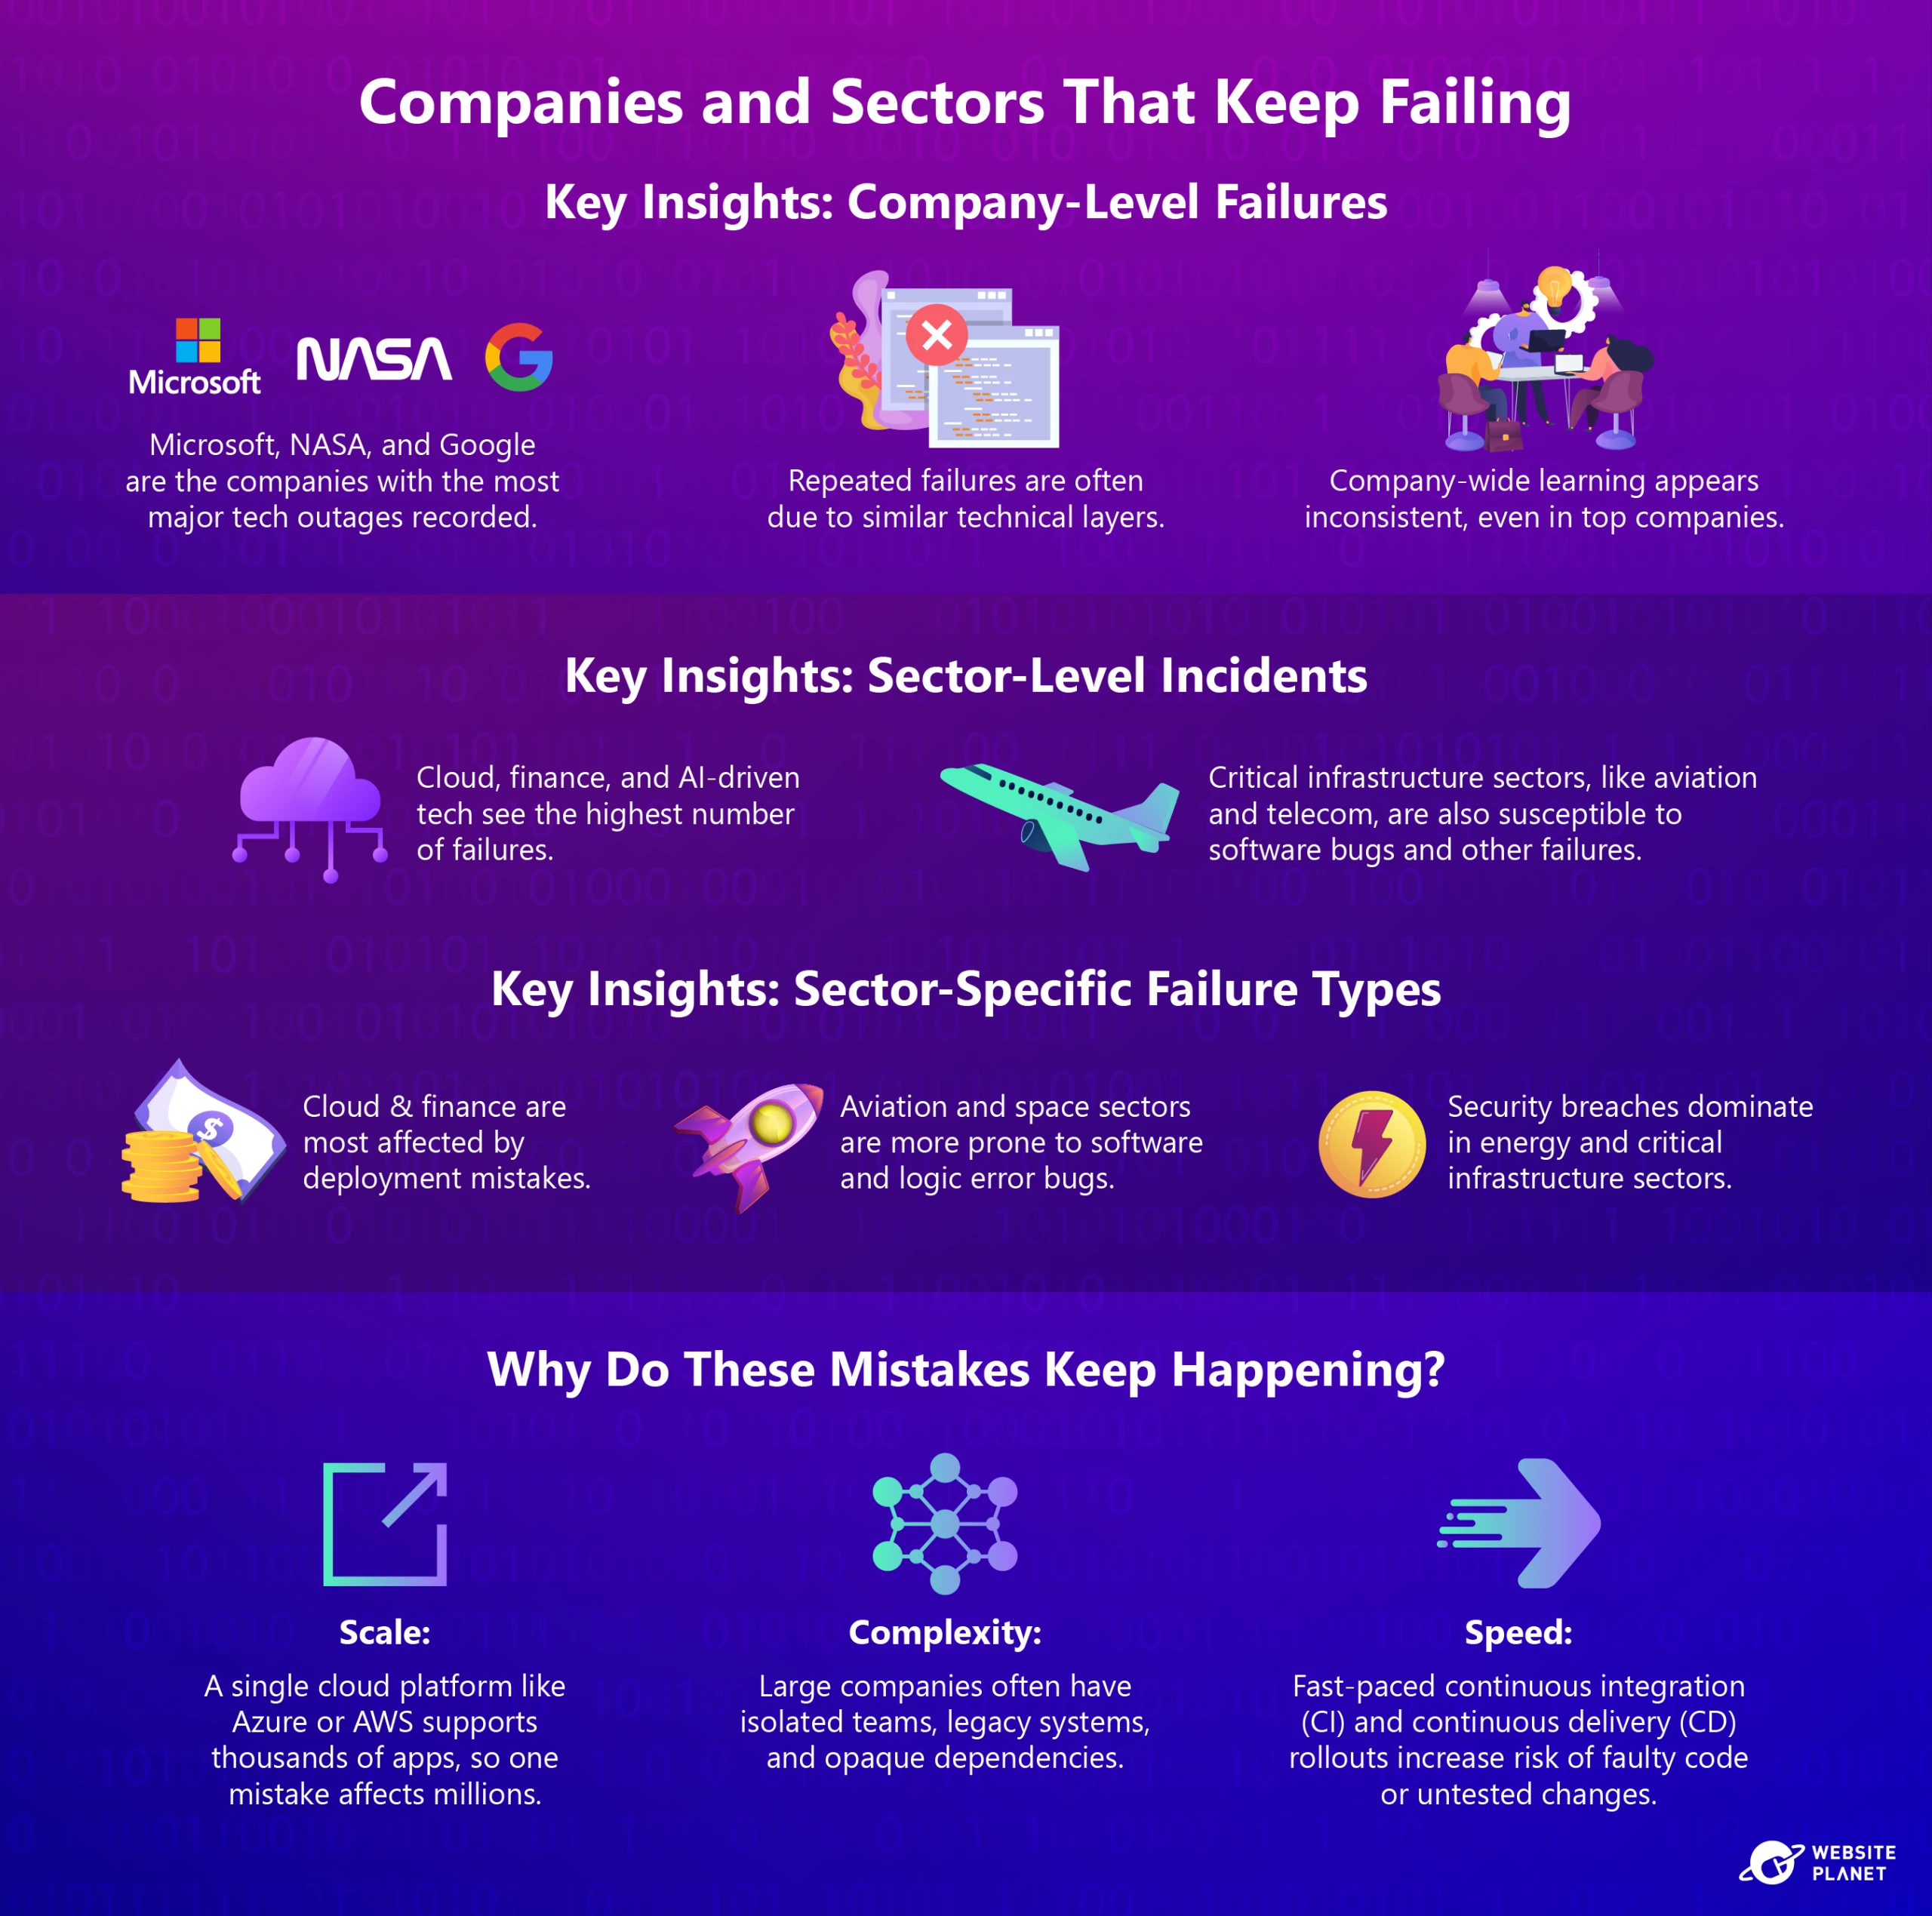
Microsoft leads with 8 major outages, followed by NASA and Google with 7 each. Apple, Meta, and Amazon Web Services (AWS) round up the top tier with 5 incidents recorded per company.
While it’s true that big companies operate more services and face greater scrutiny, their failure patterns suggest that even the world’s top tech corporations can struggle to learn from past mistakes.
Take Microsoft for example, its Azure AD misconfiguration in 2021 locked out global enterprise users for more than five hours. This was one of several identity and access-related failures within Microsoft’s infrastructure that year.
At sector-level, some industries seem to face tech failures more often than others. Cloud computing and SaaS top the list with 24 major incidents, followed closely by financial services (22) and emerging tech like AI and blockchain (19).
Even in mature sectors like aviation (13) and telecom (10), large-scale disruptions continue to occur. Furthermore, the most common type of failure varies by industry.
In cloud computing, nearly 40% of incidents stem from configuration and deployment errors, often introduced through automation. Meanwhile, sectors like energy and utilities face more security breaches, whereas aviation suffers most from software bugs and control logic failures.
These repeated failures, rather than being isolated technical missteps, can indicate systemic gaps in certain sectors.
Nevertheless, though the causes may differ, the outcome remains the same: billion-dollar losses and reputational damage caused by preventable errors that weren’t caught in time.
What We Can Learn (and Still Aren’t)
Modern tech outages may look complex, but most start with simple, preventable mistakes. As systems become more connected, automated, and fast paced, the impact of these small errors become more staggering.
After analyzing the last few decades of high-impact failures, we can say that companies have improved at responding to outages, but not necessarily at preventing them.
Cloud- and software-as-a-service providers now fix outages faster, and more companies publish incident details as well as the steps taken to resolve them. Yet the same types of errors keep on happening: misconfigurations, expired certificates, and logic flaws.
Our analysis shows that some of the most expensive disasters are repeat of errors that have occurred and been resolved before. This suggests that the key to avoiding these errors isn’t about creating better software, but about building stronger processes.
In the end, these failures aren’t just about bad code or flawed tools. They’re also about forgotten lessons and safety practices that don’t scale as fast as the systems they’re meant to protect.
Until organizations focus on prevention as much as on response, even the most advanced systems are likely to remain vulnerable to the smallest missteps.
In a world where one error can shut down hospitals, ground planes, or freeze global financial systems, resilience isn’t optional.
Methodology
To understand the causes and costs of major tech outages, we compiled a structured database of 184 significant failures from 1961 to 2025.
Incidents were selected based on either substantial financial loss or significant user impact, using publicly reported information from media coverage, industry reports, and company disclosures.
For each incident, we recorded the date, the organization involved, a short description, the primary error type (e.g., software bug, configuration issue, human error), and reported financial damage where available.
While we initially considered including downtime duration and user impact, these metrics were too inconsistently reported to be used across the dataset.
Once compiled, we analyzed the data both quantitatively and qualitatively. Quantitative analysis focused on trends over time, error type distribution, and financial losses. Qualitatively, we identified recurring patterns across failures, like common deployment errors, single points of failure, and overlooked system dependencies.
Limitations of this study include underreporting of internal or non-public incidents, inconsistent data availability and resultant cross-decade comparison, and the challenge of attributing single causes to multi-causal failures.
Despite these constraints, the dataset offers a representative view of high impact tech failures and their root causes over six decades of digital evolution.