ClicData is a 100% cloud-based, end-to-end data analytics and business intelligence platform and technology agnostic enabling users to easily track performance through reports and dashboards. Axelle Dervaux, Marketing Manager with ClicData shares their story and offers some key insights into common mistakes business owners make when implementing BI systems.
Please share the story behind ClicData: Where did it start and how has it evolved so far?
ClicData is a reporting and business intelligence platform that was rolled out in 2015 after over 5 years of research and development. The goal was to offer a fully integrated, powerful but accessible BI tool to mid-market businesses and business units in Enterprise organizations. And that’s what we did.
During these 5 years of R&D, we developed:
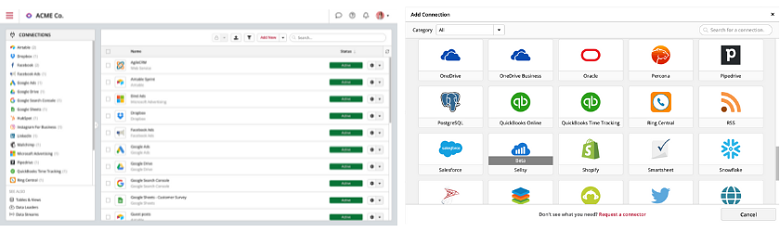
Hundreds of native connectors to cloud applications, databases, and APIs through a Web Services connector,
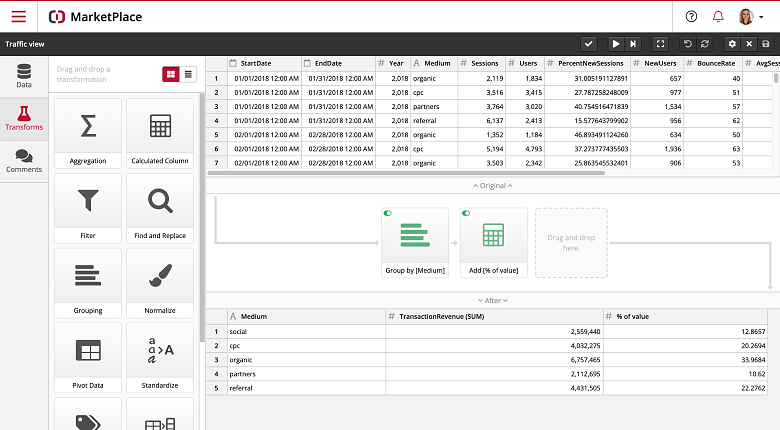
Extensive data processions tools: you can cleanse raw datasets, combine, merge and fusion data, create custom calculations, and much more,
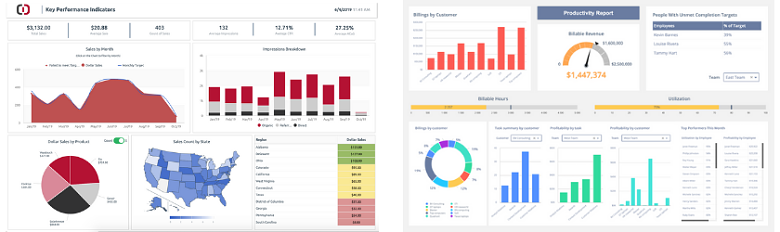
Build custom dashboards with interactive charts, tables, maps and indicators,
Automate data refreshes, alerts and notifications based on custom thresholds,
Collaborate and share live dashboards with internal and external users through live links or emails,
We also developed mobile apps so that our users can access their dashboards from their smartphones and tablets.
Today, thousands of organizations of all sizes and across multiple industries are using ClicData to manage their data and monitor their performance indicators.
What solutions do you provide?
ClicData works with companies across all industries – retail, healthcare, hospitality, technology and service providers, telecom, manufacturing… Because we’re able to get data from thousands of systems, applications and databases. While most reporting and business intelligence tools focus on marketing, financial, or enterprise systems, ClicData does it all. That means ClicData can be the go-to platform for reporting and KPI monitoring for the whole company. It also means better data management and governance, security, consistency in the dashboards, and better management of every department’s performance.
Could you give us an example of the challenges that businesses are faced with that ClicData can assist with?
Our customers come to us to solve reporting issues or improve their processes and each business is different. But they all share the same issue – their data is everywhere: in Excel, in their ERP or CRM, they also use social media, Google Analytics, they most likely have a database. Making sense of all that data is complex but also critical to make informed decisions.
With ClicData, they can:
Pull data from all their systems and refresh it as much as they need without worrying about buying a new database or data warehousing tool.
Massage the data to make it usable in dashboards. With ClicData, they can build custom datasets with data from their CRM, marketing or financial systems, then build actionable KPIs (Marketing ROI, Avg time to sell, Closing Percentage per Channel, Year over Year Financial Performance, etc.) and ultimately make better decisions for their business.
What are ClicData’s biggest differentiators in the Business Intelligence market?
ClicData is a powerful, smart and easy platform. We enable users, from technical specialists, data analysts and business analysts to powerfully transform and interpret data as required as well as integrate with machine learning and advanced analytics tools. The platform provides smart data management (ETL) and data visualizations which are interactive and customizable allowing end-users to draw informed decisions. Because we are end-to-end and 100% cloud it is easy to integrate the data, transform the data and visualize the data and then share that data and dashboard with your teams. The user interface is intuitive and accessible even to non-technical users, for instance business users from Marketing, Sales and Financial teams can build dashboards without any technical background or assistance from IT.
Our data analytics platform is different in many ways:
100% cloud: Accessible from any browser or any device with no infrastructure needed or maintenance cost required. It’s easy to start and easy to scale.
End-to-end: ClicData is fully integrated. From the data integration, data prep and analytics, to your dashboard – everything is done on a single platform.
Universal: ClicData fits into any data ecosystem, regardless of your function or industry.
What are some of the common mistakes business owners make when implementing BI systems, and do you have any advice to share?
We wrote a blog that answers this question in detail, but there are two main mistakes that we often see:
Mistake #1: Overlooking the importance of BI tools
Somehow, business owners and managers think they can’t do business without a CRM or Invoicing systems because they’re part of their day-to-day operations; but not having access to a BI tool or not having one at all is not critical. They can always turn to Excel or similar applications for reporting.
Our advice: There’s no other way to say it, change mindsets! Having a proper reporting system that automatically pulls data from all your applications is mandatory to make informed decisions and run your business efficiently.
Mistake #2: Choosing your BI tool without consulting end-users
Some business owners and managers do understand the value of having a BI tool, but they tend to forget the end-user when choosing the system. It’s usually too technical, not user-friendly, or doesn’t fit their need (overkill or not flexible enough).
Our advice: Involve the dashboard users in the selection process before you even benchmark BI tools online! Make sure you understand what they need to measure, where their data is sitting, how many dashboards they need to create, how often they need to update their KPIs and refresh their data. You also need to consider the users’ technical background to make sure they know how to use the BI tool, and if needed, check if the provider offers support and online documentation. Checking all these criteria will ensure a better user adoption internally.
Are there any new developments or exciting updates in the pipeline that you would like to share?
Yes! Many exciting features are currently in development or soon-to-be released:
Data Flow module that will include all our current data processing tools and more (sentiment analysis, advanced table machine learning trending and segmentation, creation of sub-tables from multiple value fields, and more.)
Report Module: this new module allows you to create multi-page tabular reports PDF reports and distribute them to internal and external users.
Insights Modules: they are the fastest way to quickly get a bird’s eye view on any table, view merge, or fusion. Quickly pivot and group data, segment it, or trend it. Save the analysis for future comparison or use it in other modules.
Chené is a dynamic content writer especially interested in MarTech and digital marketing. Residing in the cosmopolitan city of Cape Town, South Africa, her interests include being active in the outdoors, exploring the city and connecting with others.
Thank you, - your comment was submitted successfully!
We check all user comments within 48 hours to make sure they are from real people like you. We're glad you found this article useful - we would appreciate it if you let more people know about it.
Share this blog post with friends and co-workers right now:
Thank you, , your comment was submitted successfully!
We check all comments within 48 hours to make sure they're from real users like you. In the meantime, you can share your comment with others to let more people know what you think.
Thank you for signing up!
Once a month you will receive interesting, insightful tips, tricks, and advice to improve your website performance and reach your digital marketing goals!