
I feel like it’s a bit of an understatement to say that Google Analytics 4 can be overwhelming – it’s a lot to take in even if you have previous experience with website analytics. It’s not always easy to figure out which reports matter most to you and your website, and you don’t want to miss out on information that could mean better decisions and more money in your pocket.
Don’t worry – in this beginner’s guide, I’ll show you everything you need to become an expert at Google Analytics in 2026. You’ll learn how to set up Google Analytics with your website, along with how to monitor your traffic, understand the various reports, and much more.
What is Google Analytics 4?
Google Analytics 4 (GA4) is the latest version of Google’s analytics platform, and was designed to meet the needs of modern digital marketing professionals in a way that its predecessor struggled to do.
GA4 provides valuable insights into how real users actually use your website or app. You’ll be able to see everything, from how users found your site, to the journey they took when purchasing your products and services.
By tracking these user journeys, or “events”, you can better optimize your website, improve your marketing efforts, and ultimately, get more money in your pocket. Here’s how:
- Understand your target audience. While you won’t get a full, personalized account of each visitor, you’ll be able to understand what users intend to achieve based on their behaviour. This’ll help you to draw up audience segments so you can target them with meaningful content.
- Track customers across devices. GA4 can tell you if a customer visits your website on their desktop device, and then later on their smartphone. By tracking where customers find you and if that’s different from the device they use for purchasing, you can optimize your marketing efforts.
- Enhance user experience. If your users are getting frustrated at certain points in their journey, you can see exactly which page they clicked off. This gives you all the data you need to improve your website structure and content to keep your users engaged.
- Optimize ad messaging. You’ll be able to see how your ad campaigns are performing based on how much traffic they’re bringing in and whether they’re resulting in increased conversion rates.
- Improve website SEO. GA4 works with all of Google’s other marketing tools. So, you’ll be able to connect it to Google Search Console to understand the search keywords your customers use to find your site, and whether those search terms result in conversions.
- Streamline e-commerce funnels. You’ll be able to see a huge range of e-commerce data, covering everything from product views to how many customers add something to their cart but don’t purchase. This can help you to optimize your inventory, set up better user flows, and target users with persuasive “abandoned cart” messaging.
How to Set Up Google Analytics 4 on Your Website, Step-by-Step
This guide assumes that you don’t already have a GA4 account. If you used to use Universal Analytics (UA), the predecessor of GA4, then you may already have an account with tracking for your website or app that was automatically created for you.
However, the following steps still work if you want to disconnect the old tracking and set your website back up again. In which case, go to Admin > Create > Property instead of creating a new account, then follow the steps below.
Step 1: Create and Configure Your GA4 Account
Log in to, or create, a Google account. Then, go to analytics.google.com and click Start measuring.
From there, set an account name and select what data you’re happy to share with Google. By default, you’ll share all of your account data to get recommendations, predicted data, and access to the technical support team. You can turn all of these off, though.
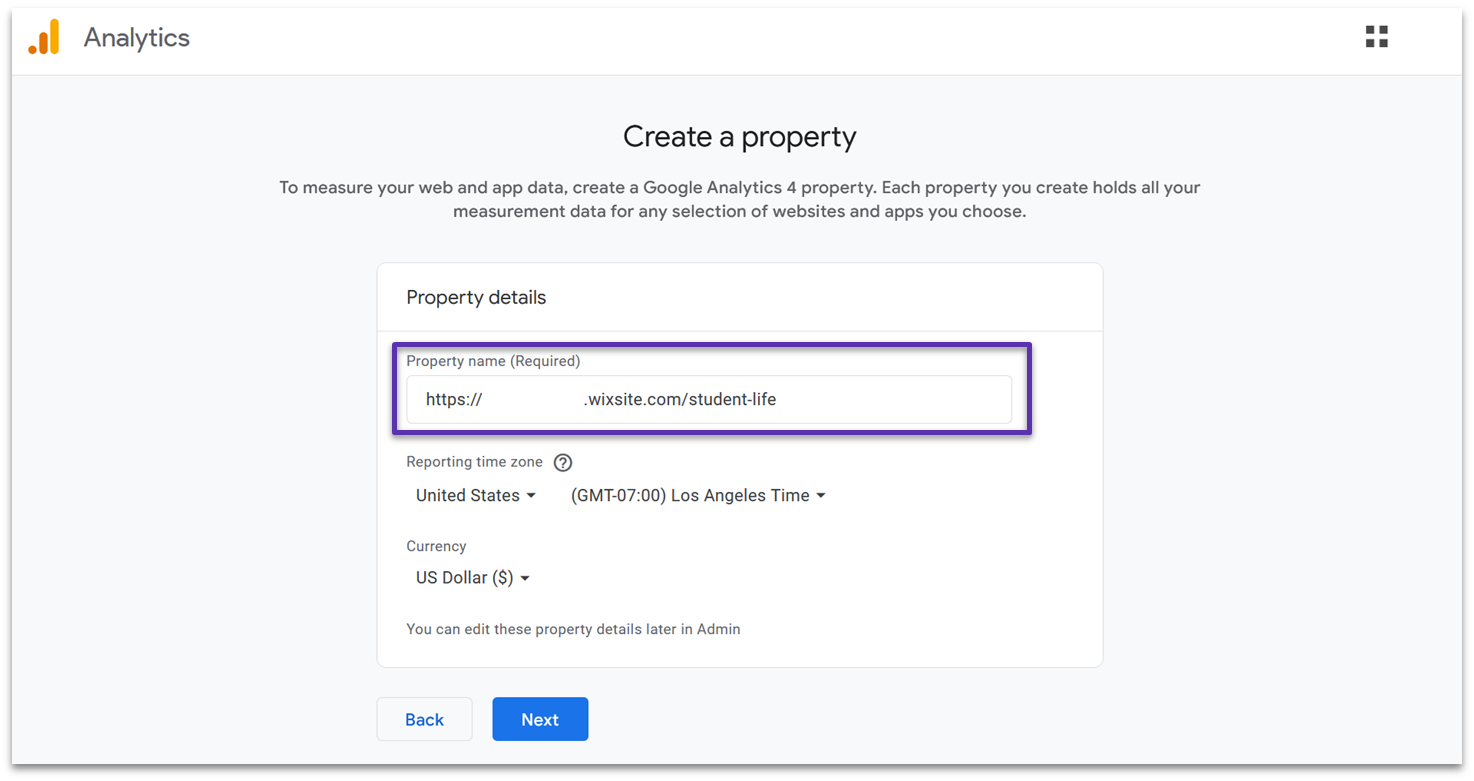
On the next page, you’ll create a property. This is just a way to separate the data of the websites you want to check. Name your property, and select your time zone and currency. I recommend using your site’s URL as your property name to make it distinguishable from any other sites you might track.
Then, you’ll need to provide Google with some details about your business. Select your business’s industry and size. On the next page, select why you want to use GA4 – I recommend picking just one objective for now.
You’ll then need to agree to Google’s terms of service before you can move on.
Step 2: Configure Your Website in GA4
Choose a platform to start collecting data from – you can choose from the Web, or apps on Android or iOS.
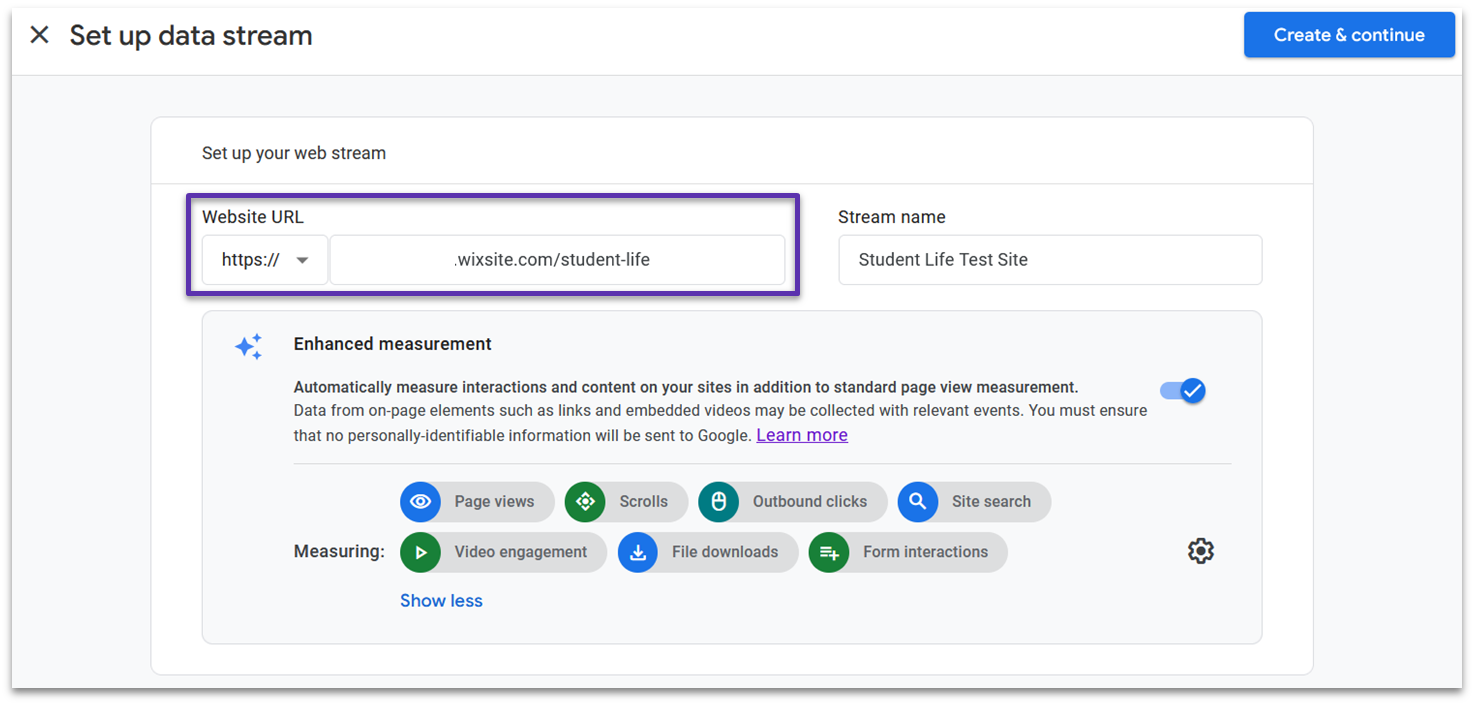
Then, you’ll need to set up a data stream for your website. Paste your URL into the Website URL field, and name the data stream.
You’ll also be asked if you want to use Enhanced Measurement, which automatically captures events like page views, form interactions, and file downloads. You can choose to turn this off completely or toggle off individual events. I recommend leaving this on for now. When you’re ready, click Create & continue.
Step 3: Add the Google Tag to Your Website
Now that you’ve set the data stream up, you need to connect it to your website. GA4 uses a Google tag to do this, which is a short snippet of code that sends data back to your analytics account.
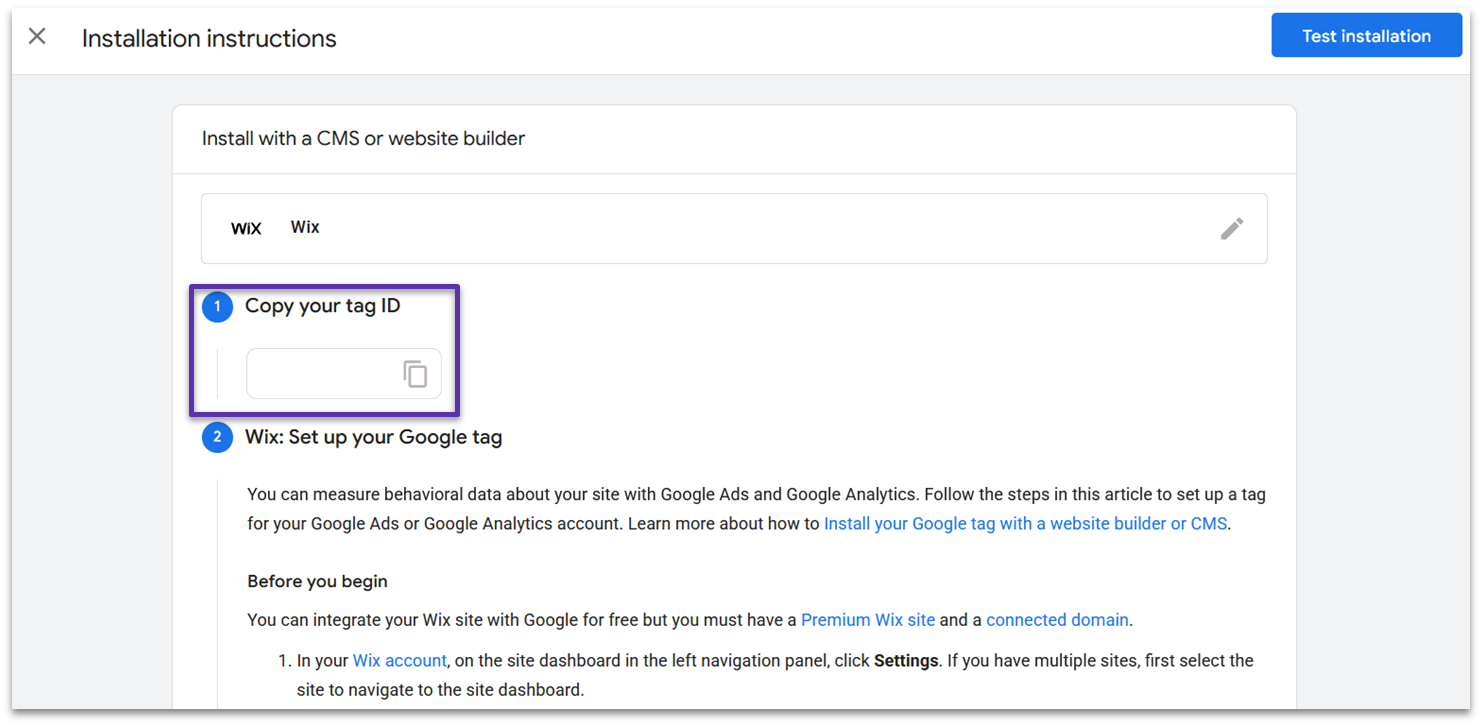
Google identified that I’m hosting my site on Wix, so it automatically directed me to the instructions for installation on Wix. GA4 provides instructions on how to install a Google tag on a ton of different platforms, like Wix, Squarespace, Shopify, and WordPress.
If your chosen platform isn’t listed, then you may have to install the Google tag manually.
Installing a Google tag on Wix is super simple. Go to Settings > Marketing Integrations > Google Tag > Connect > Add Google Tag > Add Google Tag ID. Then, paste your tag ID, and click Save.
Step 4: Check GA4 is Working (Optional)
Head back to your GA4 setup tab and click Test installation to make sure the platform detects your Google tag. Once GA4 detects that your Google tag is working properly, you don’t need to do anything else. However, it can help to check that your data stream is working correctly.
If you skipped the Test installation button earlier, then GA4 will make it clear if it can’t detect your tag. You’ll be able to reopen the instructions you need to try again.
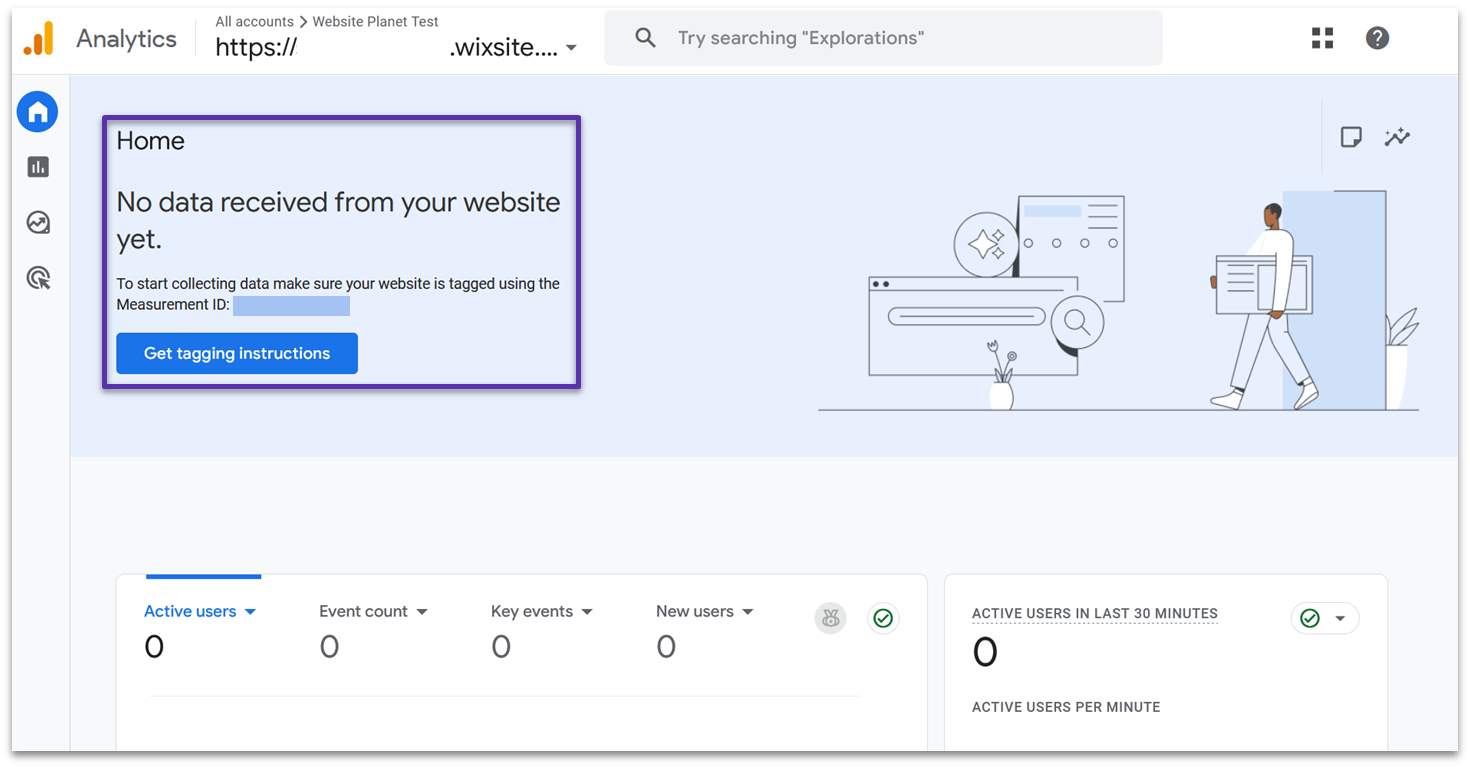
Just bear in mind that it can take 30 minutes for data to start appearing on your dashboard. So, I recommend grabbing a cup of coffee and taking a break before you check. If you clicked out of your dashboard once you finished setting it up, head back to your account and click All accounts in the top left corner to make sure you’re viewing the right property.
You should see data appearing under Active users in last 30 minutes if the tag is installed correctly. Alternatively, go to Reports > Realtime overview – this will show you the active users in the last 5 minutes.
If you’re still not seeing any data, then try using Google Tag Manager’s Tag Assistant. To find this, go to Google Tag Manager. Click Google tags and find the tag for your website. Click into that, then go to Admin > Launch tag assistant. Finally, enter your website’s URL.
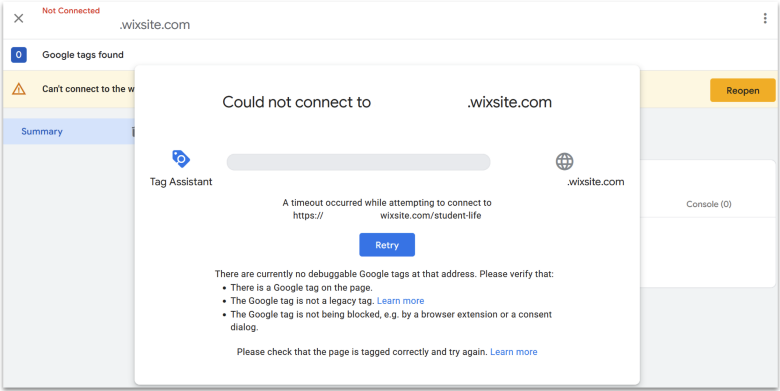
This tool will attempt to connect to your website and debug any installation issues. In my case, I wasn’t able to add a Google tag to my test Wix site as I’m using a free plan. So, Tag Assistant responds with a timeout error because it can’t detect any installed tags.
How to Connect Google Analytics 4 with Other Google Marketing Tools
One of the benefits of using GA4 is that it works seamlessly with Google’s other marketing tools. I highly recommend connecting GA4 to Google Search Console (GSC) and Google Ads.
Doing so gives you some powerful extra data in your toolbox. For example, with GSC, you’ll be able to see how the search terms customers use to find your website translate into conversions, or if certain keywords are associated with greater engagement.
In addition, connecting Google Ads to GA4 helps you to track how well your ads perform, as well as making it easier to create ads to re-engage users who performed certain actions on your website. This helps you to craft extremely targeted messaging, which can result in more conversions.
Connecting these tools up is simple, too. All you need to do is make sure each tool you want to use is fully set up with your website. Let’s connect our new GA4 account with GSC.
- Go to Admin > Product links > Search Console links. Then, click the Link button on the top right of the table.
- Choose a GSC property. Click Choose accounts under the Choose Search Console property step. This shows a list of all the GSC accounts you’ve set up. Select the one that matches your website, and click Confirm. On the main screen, click Next.
- Attach GSC to a GA4 data stream. Click Select under the Select Web Stream step, and choose the data stream you set up earlier for your website. Then, click Next.
- Review and submit. Check that your GSC property and selected data stream match. If they do, click Submit.
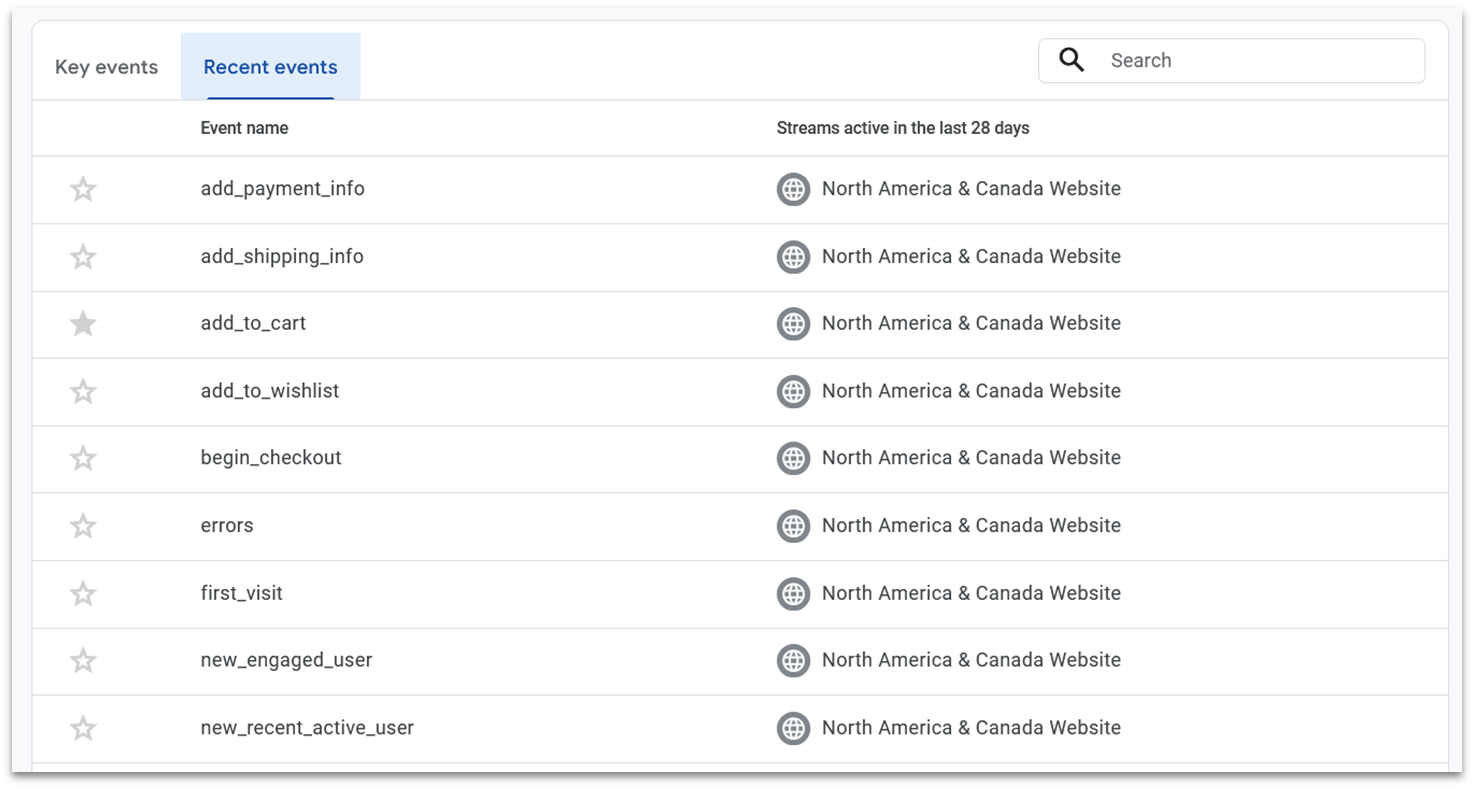
Understanding Google Analytics 4 Events
Events are digital footprints that show you exactly how users interact with your content. When someone lands on your homepage, scrolls down, or makes a purchase, GA4 logs these actions as individual events.
Key events are the most important events for your business. You can mark specific events as “key” to track your main conversion goals, like newsletter signups or product purchases.
GA4 offers 3 different types of events:
- Automatic Events. GA4 automatically tracks basic interactions like page views, scrolling, and first visits. You don’t need to set these up.
- Enhanced Measurement. If you left this checked when you set up your property earlier, you get additional event tracking for actions like file downloads, video engagement, and outbound clicks. It’s pre-configured tracking that saves you time and effort.
- Custom Events. You can create custom events to track other specific interactions or longer chains of events. However, this does require some extra setup, and you’ll need some technical knowledge.
Reading Your Google Analytics 4 Reports
Okay, so by now, we’ve (hopefully!) got a working GA4 account that’s starting to log user data. Let’s dive into the reports you’ll be able to find in GA4.
In this section, I’ll be using screenshots from one of the GA4 demo accounts, which covers data gathered from the Google Merch Store. The reports you initially see will depend on the business goals you set up earlier – this account showed reports to do with user life cycle, but you may see reports listed by other business objectives.
Home Dashboard
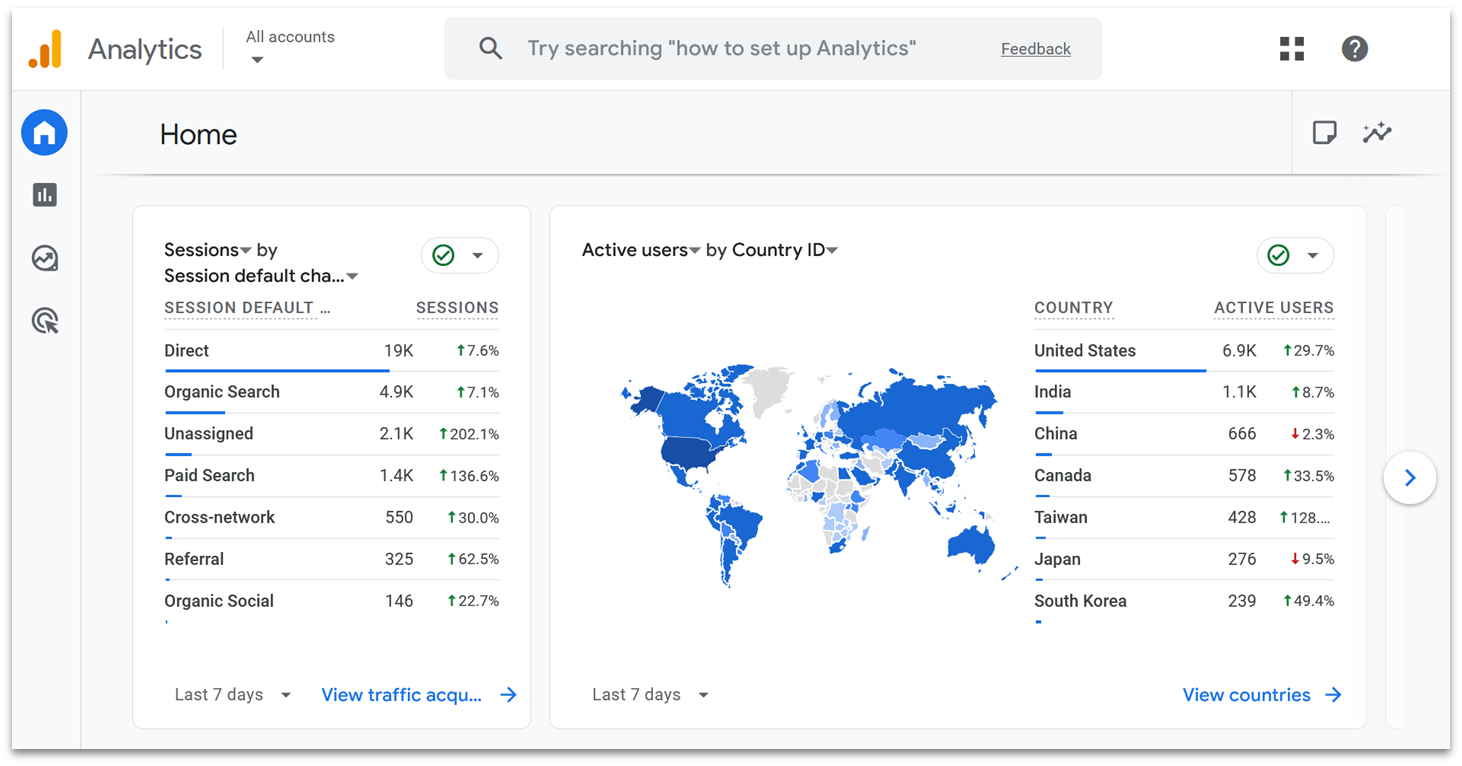
First of all, you’ll be able to see a snapshot of incoming data on your home dashboard. By default, you’ll see the active users on your website in the last 30 minutes and across the last 7 days.
If you scroll down, you’ll also see extra data suggested for you based on the reports you typically explore. If you’ve not yet gone through your GA4 account, then this might be more top-level data. For example, I saw the number of sessions and where they originated, a graph of active users by country, and a list of the most popular pages.
It’s time to get a little more granular and see what GA4 can really do. So, head over to the left-hand side of the screen and click Reports.
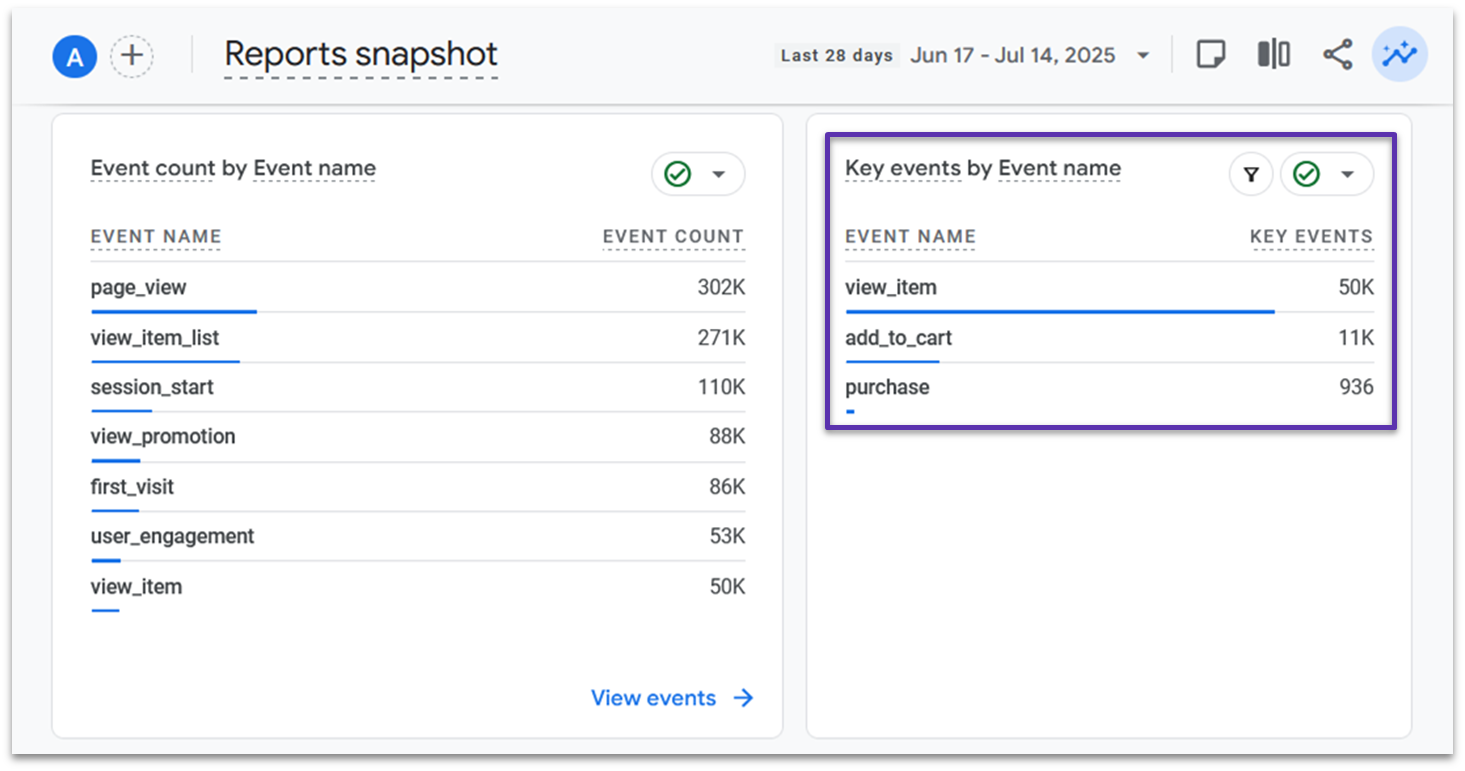
Reports Snapshot
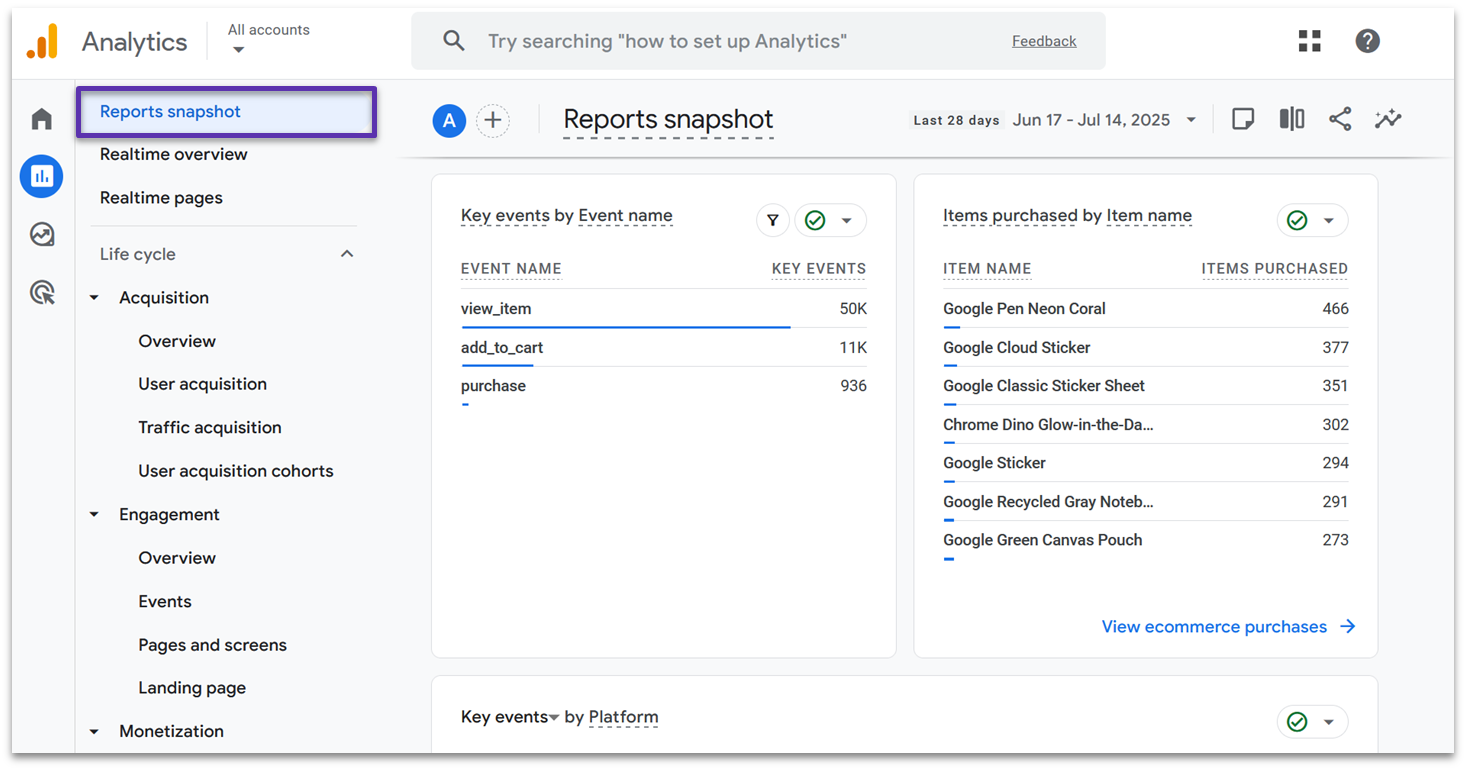
The first thing you’ll see after clicking on the Reports tab is the Reports snapshot. Like all reports in GA4, you can customize what data appears here.
This demo snapshot is set up to show the same active user information first. But, as you scroll down, you’ll be able to see more specific data. For example, you can track how many times key events are triggered, or show the most popular items in your online store.
Realtime
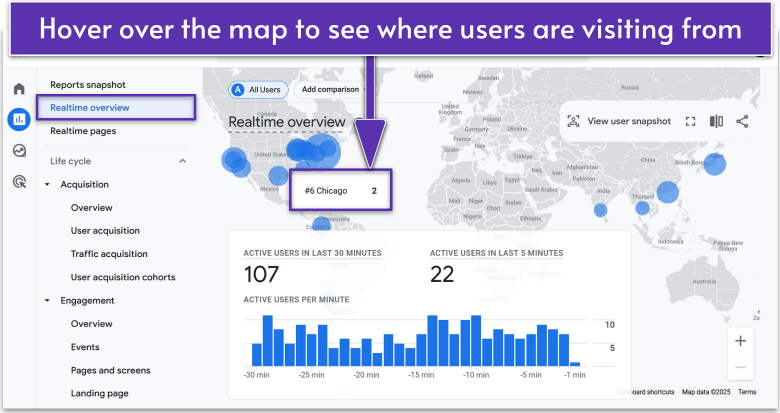
The Realtime overview and Realtime pages tabs cover what current users are doing on your site, and they refresh roughly every minute.
The first of these tabs is, as you’d expect, a brief snapshot of your active users, where they are on your site, and the events that they’ve triggered. The latter covers the page paths that are being followed, which just explains what pages users are clicking on after a category page like “/shop”.
In Realtime overview, you can even see a user snapshot that shows what a real, random active user is doing on your website. This includes how they arrived on the site and the events they’ve triggered.
Acquisition
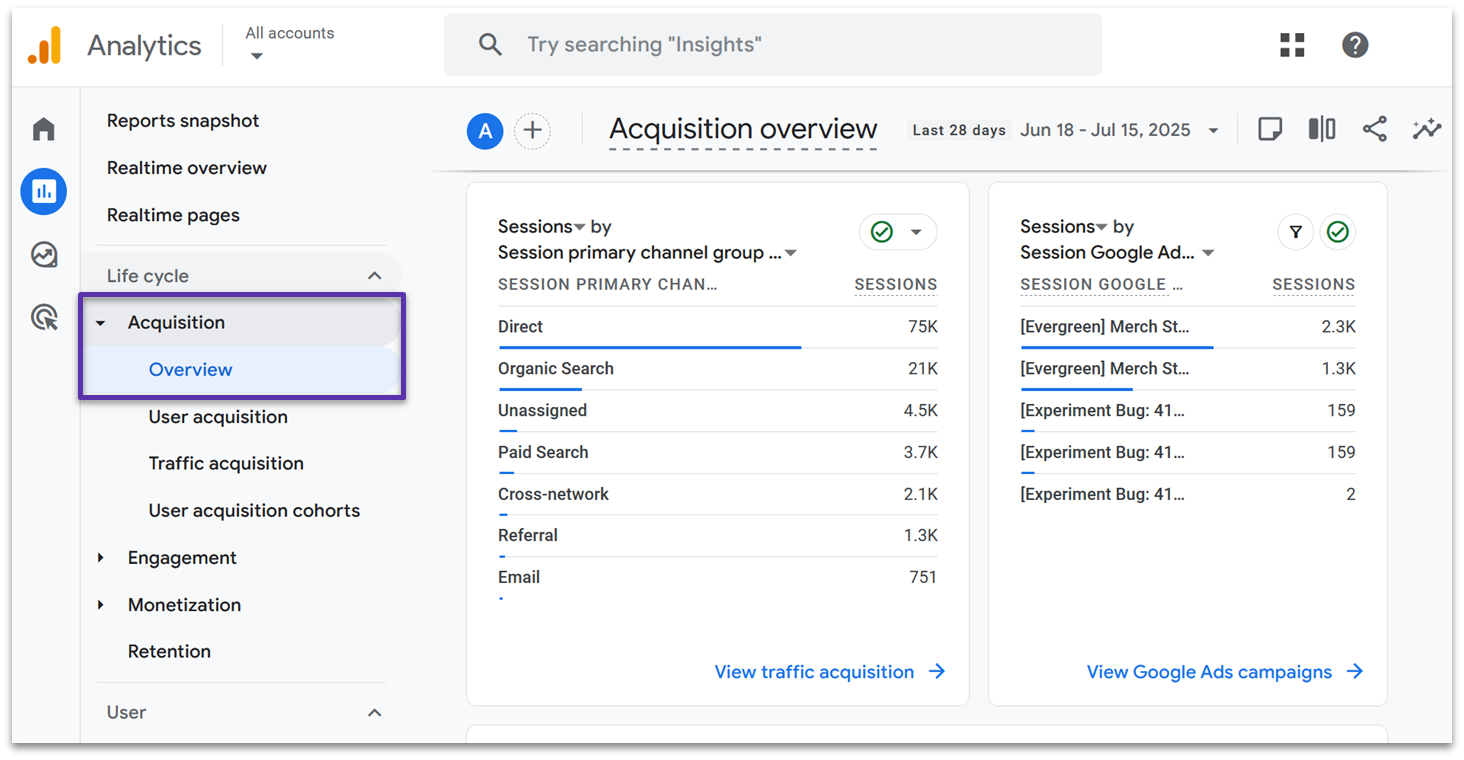
In the Acquisition tab, you can see the channels that users go through to reach your site. On the demo site, we can see that most sessions come through the user navigating directly to the Google Merch Store, but it still gets a significant amount of traffic from organic search results.
The other tabs dive into this traffic a little deeper:
- User acquisition shows the channels through which new users found your site over the last 28 days, and counts all subsequent visits from that new user.
- Traffic acquisition shows the channels through which new sessions were initiated over the last 28 days, and covers both new users and existing ones.
- User acquisition cohorts show how different user groups found your website over the last 28 days.
Engagement
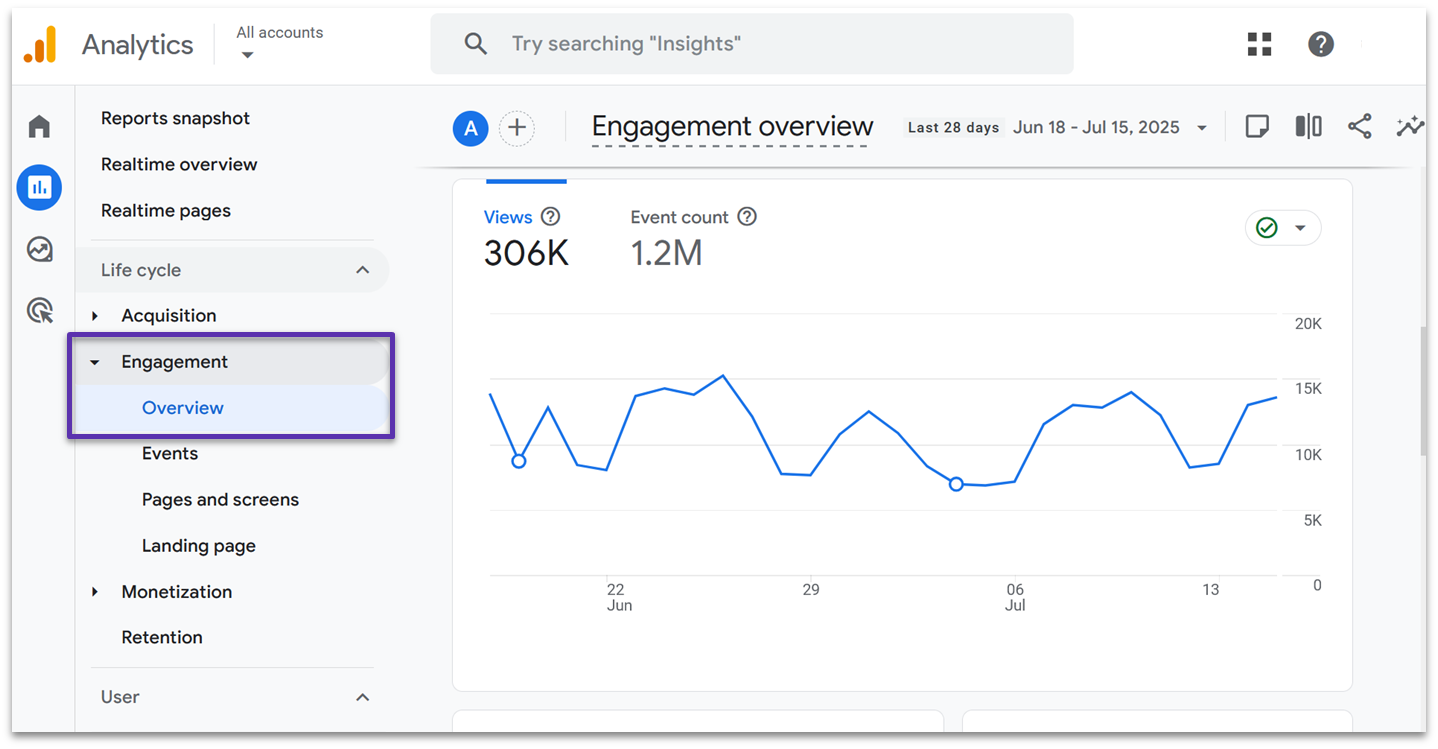
The Engagement reports show what your users tend to do on your website. The demo overview is set up to show the total number of page views and the most common events that are triggered. There’s also a graph tracking “user stickiness”, which shows whether users tend to re-engage with the site over time.
Again, we also have additional tabs that show more detailed information:
- Events shows a 28-day graph of the most common events triggered, with a list of how many times an event was triggered and the average event count per user.
- Pages and screens show the routes that users most commonly took throughout your website over the last 28 days, and this is separated by the devices that visitors used.
- Landing page shows how many sessions, active users, and new users visited your landing pages over the last 28 days, and how long they tended to stay on that page for.
Monetization
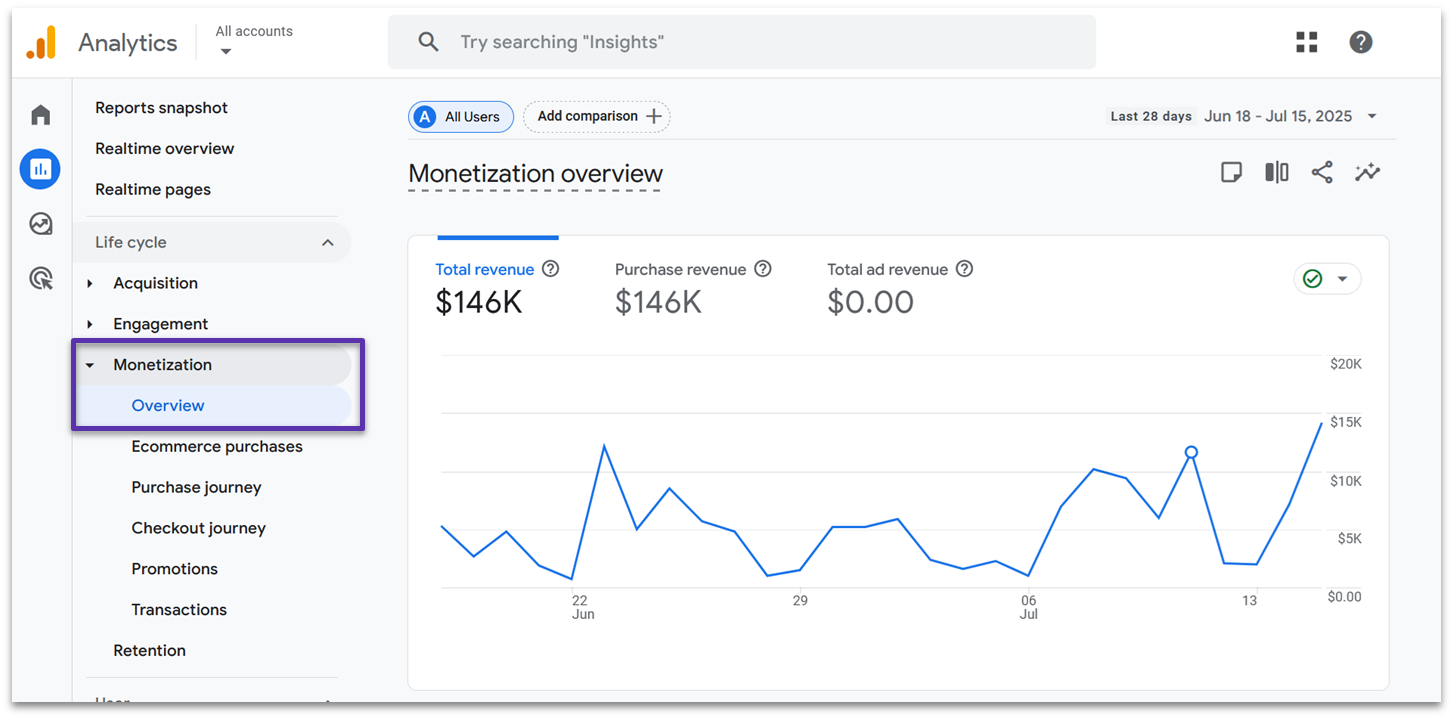
The Monetization tab is where the magic happens. In here, you’ll see whether your website is driving revenue through purchased products and ads. The GA4 demo overview is set up to show core data points like the total purchase revenue, total number of purchases, and the average purchase revenue per active user over the last 28 days.
The other tabs give you some more valuable revenue data:
- Ecommerce purchases show a trend of the most popular products over the last 28 days, and how many times those products were viewed, added to cart, and purchased. You’ll also see how much revenue that item has generated.
- Purchase journey charts how users move through the Session start > View product > Add to cart > Begin checkout > Purchase funnel, and the number of users that make it to each step by device.
- Checkout journey zooms in on the Begin checkout > Add shipping > Add payment > Purchase funnel, and shows how many users started checking out but then abandoned their purchase.
- Promotions shows a 28-day chart graphing the purchase journey for items contained in your e-commerce promotions, and includes data such as the click-through rate for promotional items.
- Transactions show the revenue generated per unique transaction ID over the last 28 days.
Retention
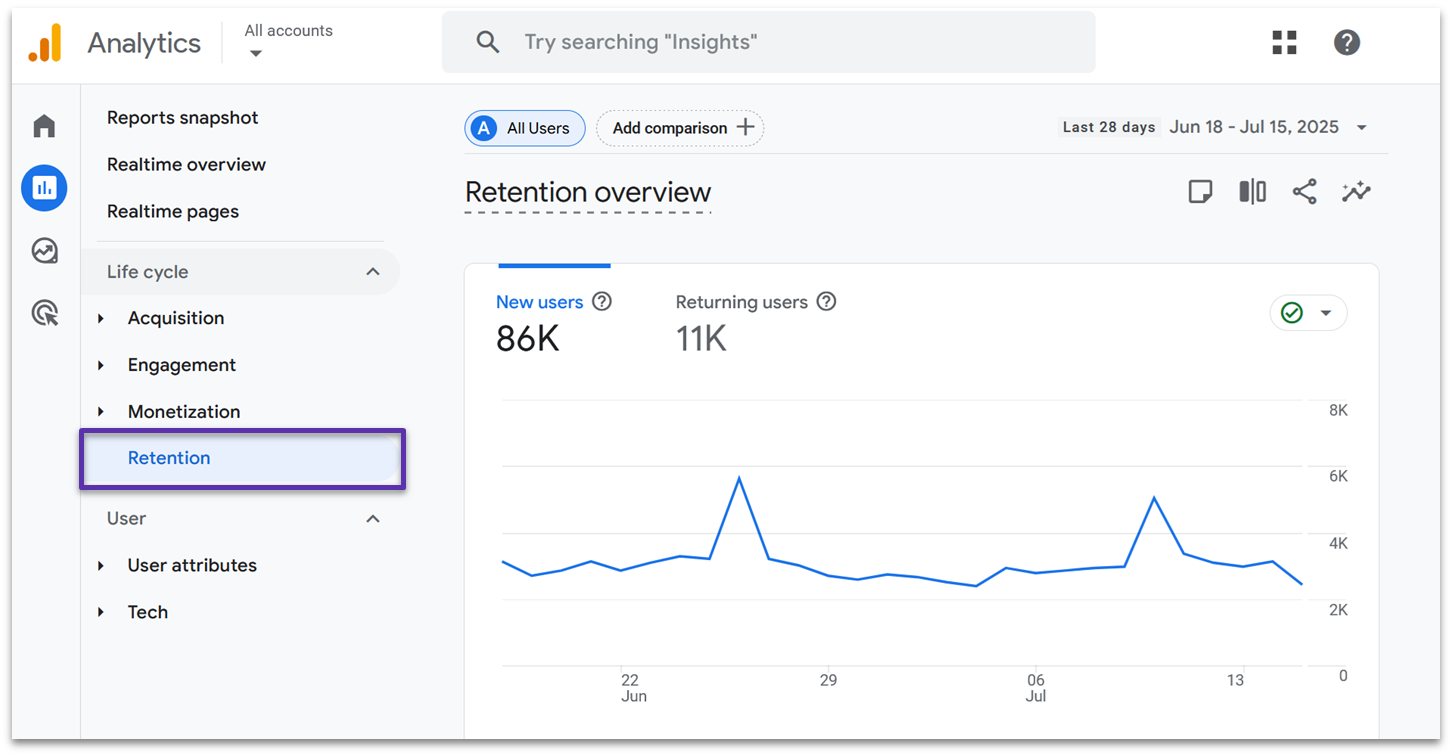
Retention covers the number of new users vs. returning users, and shows the percentage of users that re-engage with your site after the first visit over the last 28 – 42 days. Unlike the other reports, there aren’t any additional tabs that go into more detail.
It’s worth noting that, in GA4, a new user is counted if they haven’t visited before in the specified date range. They may still have visited your website before, but their last visit preceded the date range you have set. Returning users, on the other hand, are those who have visited multiple times in the specified date range.
User Attributes
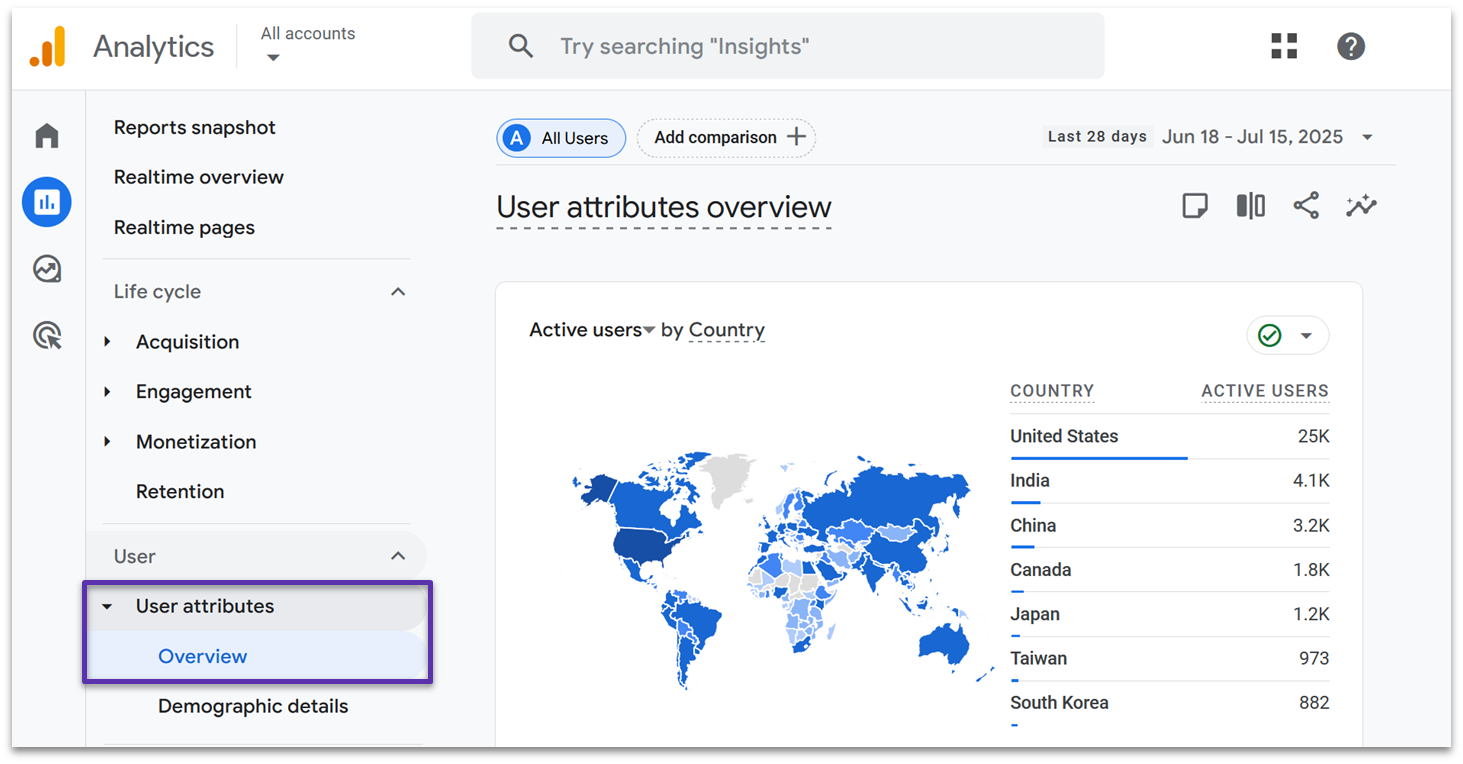
In User attributes, you’ll get to learn more about your visitors. While you’ll see the same active users graphs as in previous reports, you’ll also get city-level location information. You can also get charts that break down your active users by gender, age, and interests.
There are also 2 other tabs to explore:
- Demographic details show a 28-day trend of active users by country, gender, age, interest, and any other available user details.
- Audiences show the trend of defined user groups, like “engaged users” or “users in San Francisco” over the last 28 days.
Tech
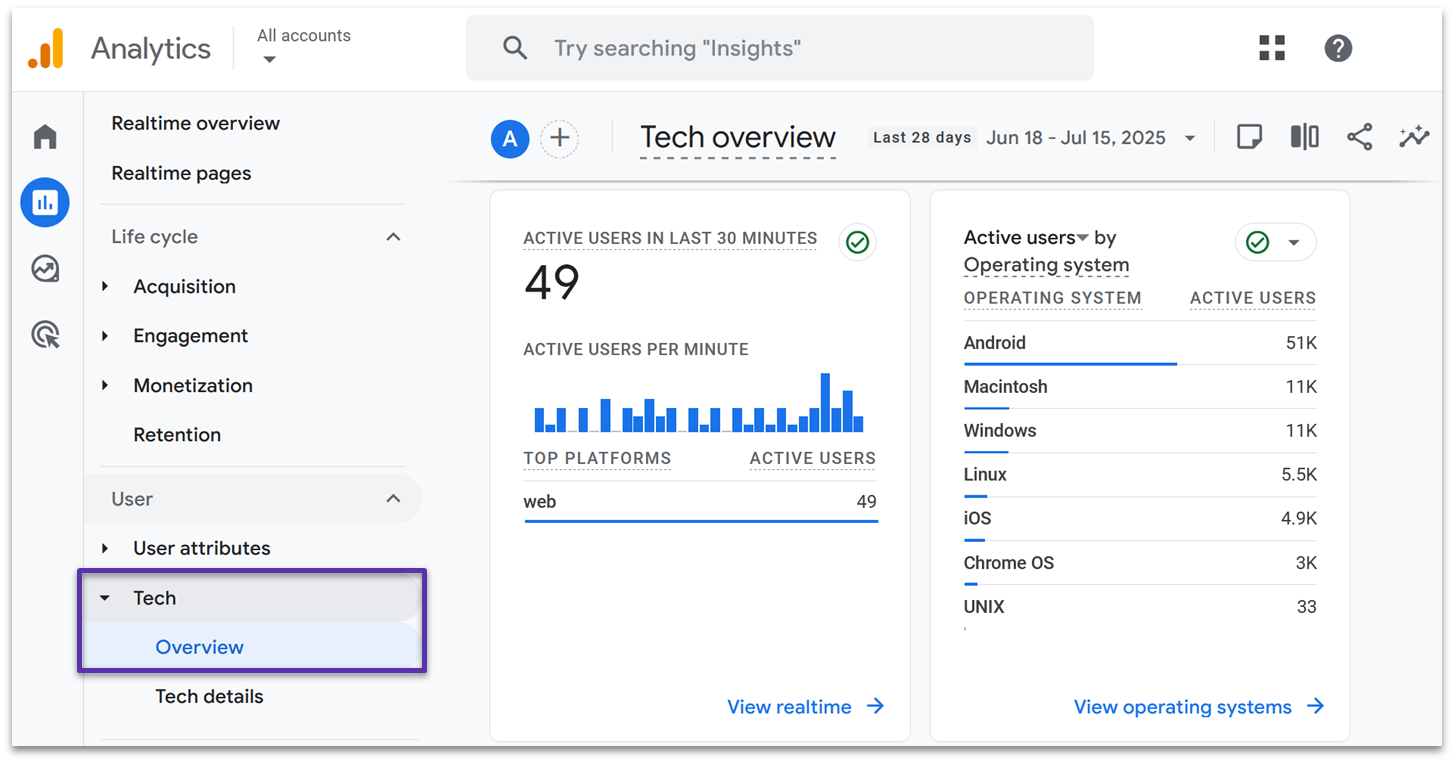
The Tech reports cover which platforms, devices, and browsers your visitors use. You’ll even get more detailed information, like the screen resolutions that visitors tend to use. If you’re tracking an app, you can also see active users grouped by the app version they’re using.
Like the other reports tabs, there’s a detailed Tech Details tab that shows a 28-day trend of which browsers, platforms, and devices are in use.
Google Analytics 4 and Data Protection Regulations
You can use GA4 while staying compliant with data protection regulations like GDPR and HIPAA. To protect your users’ privacy and meet legal requirements, GA4 comes with data protection features built in, but you may have to make some adjustments based on the regions your business operates in.
Regional Controls
GA4’s regional controls help you manage how you collect and use data in different locations. This is essential if you have website visitors from regions with strict privacy laws.
By default, GA4 collects “granular location and device data”, which includes the visitor’s city, browser, device model and manufacturer, screen resolution, and more. However, you can toggle this data collection off on a per-region basis. If you do, no new data will be collected, but historical data will still be available.
In addition, GA4 has specific controls for data collection in the EU. By default, it doesn’t store any IP addresses from users in the EU. All EU data is also collected on servers in the EU before it’s forwarded for processing.
Consent Mode
GA4 can be configured to automatically adjust its data collection if visitors don’t consent to cookies. If visitors deny all cookies, GA4 will collect less data, use built-in modeling to fill in the gaps, and continue basic tracking where permitted.
GA4 will also adjust to visitors who consent to some cookies but not others. For example, users might consent to non-personalized ads, which will turn off any data collection for ad personalization. But it will still allow the platform to track the user’s engagement with ads.
This feature is particularly important if you have European visitors, as the GDPR requires explicit consent for data collection.
Data Redaction
GA4 automatically protects your users by removing email addresses from tracking. If it detects that a user’s email has been passed as a “parameter” (chunk of data), then it attempts to stop that data from being passed to the platform.
On top of that, you can set GA4 to redact PII if it’s detected as a parameter in the web page’s URL. However, you have to turn this on yourself, and it’s only available for website tracking. Plus, it only works for certain event types.
Advanced Google Analytics 4 Tips and Tricks
Now that you’ve mastered the basics, you might want to explore some of GA4’s more powerful features. Don’t feel pressured to implement these right away – they’re completely optional and best tackled when you’re comfortable with the fundamentals.
That being said, these advanced techniques can provide valuable insights to help grow your business, from tracking specific customer behaviors to creating detailed custom reports. Consider bookmarking this page and returning to it when you’re ready to take your analytics to the next level.
Audience Segments
GA4 automatically creates useful audience segments, or groups, to help you understand the different kinds of visitors to your website. You’ll find these by going to Admin > Audiences or Segments. By default, GA4 tracks segments like All Users, Purchasers, and New Users.
If you want to take this to the next level, you can create custom segments to track specific groups. For example, you can track 7-day inactive users to find people who haven’t visited your site in the past week. When you set up a custom segment, GA4 offers helpful suggestions to get you started.
GA4 also includes predictive segments, like Likely 7-day churning users. This helps you identify users who might stop visiting your website.
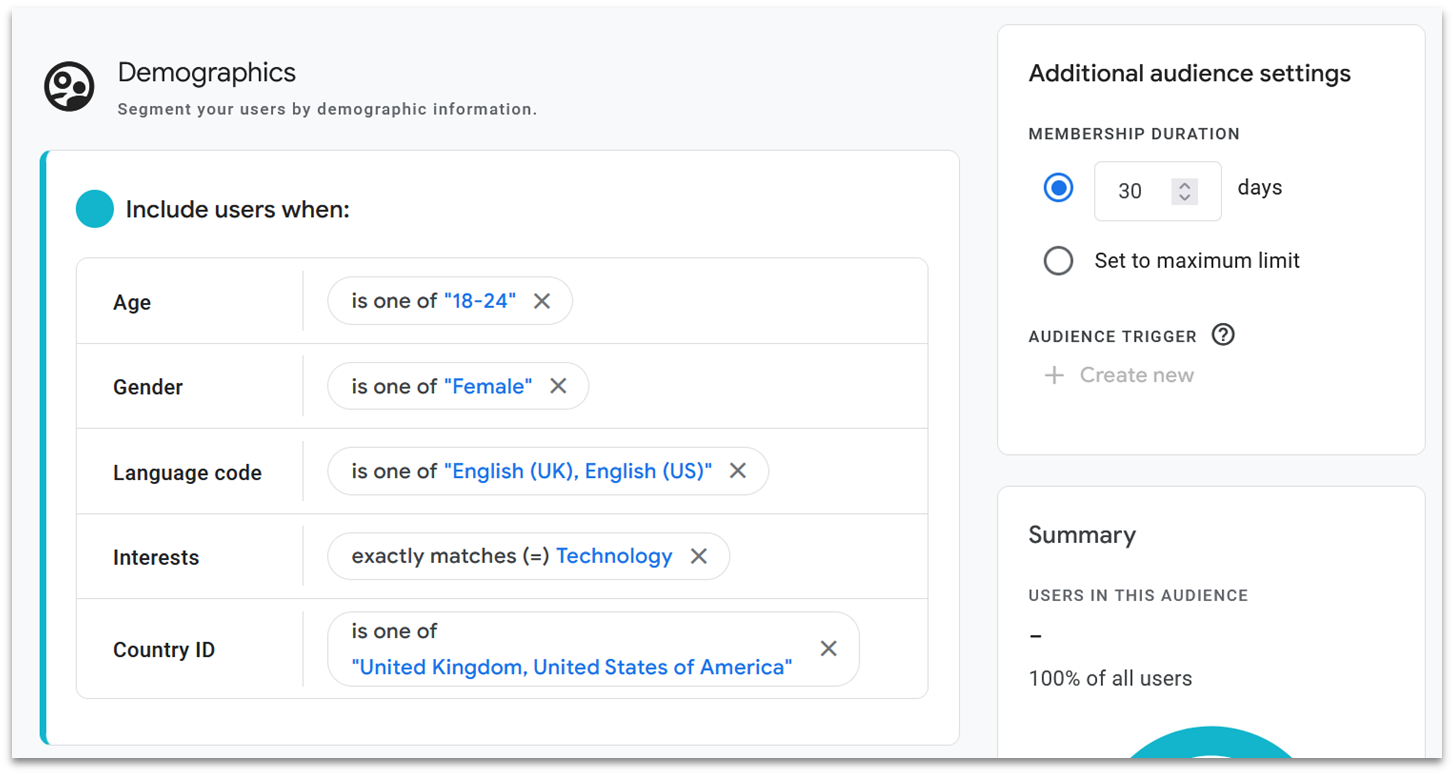
You can get even more specific by combining different types of data. GA4 even includes handy templates for setting up segments that track by demographics, technology, or acquisition. For instance, you could create a segment to track female users in London who haven’t visited in 28 days.
Insights and Predictions
GA4 uses AI to make your analytics smarter and more useful. When some users don’t consent to data collection, GA4’s AI fills in these gaps with predicted data, giving you a more complete picture of your website’s performance.
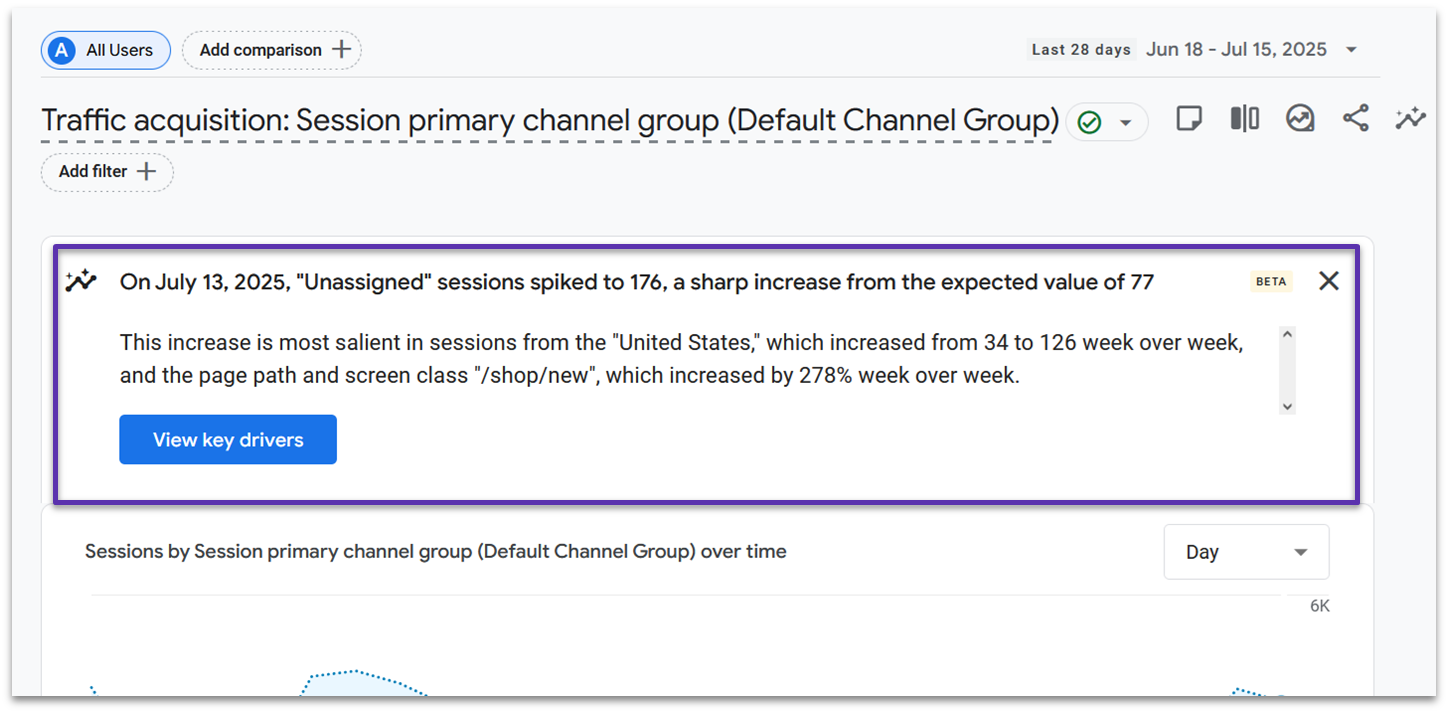
The AI also automatically spots important patterns in your data. In your reports pages, you’ll see an alert when something noteworthy happens, like an unusual surge in visitors from social media or a significant drop in sales from a particular product page. These automated insights help you catch important trends without having to dig through the reports.
One of GA4’s most helpful features is the search bar at the top of your dashboard. It works just like Google Search, so you can type in questions like “how many new users did we get last week?”. The AI will either show you where to find this information in your reports or give you a direct answer.
Custom Events
Custom events let you track specific actions that matter to your business. You can find these under Admin > Events.
For example, e-commerce stores can track if a user adds an item to their cart or views a promotion. If you’re a service provider, you could set up events that trigger when someone visits your pricing page or when they download a free guide. You can also mark your most important events as key events, making them easier to find in your reports.
While the basic concept is straightforward, setting up custom events often requires some technical knowledge. The actual implementation involves working with code and event parameters, which are topics that deserve a dedicated guide.
If you’re interested in setting up custom events, consider working with a developer or exploring Google’s relevant technical documentation.
Custom Reports
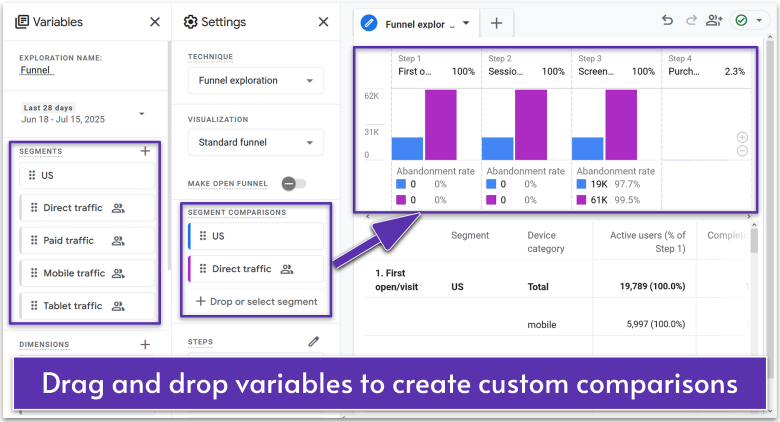
Any report page in GA4 can be customized. Simply click the pencil icon, and you can add new “cards” (graphs) to track the data that matters most to your business.
However, you can go further in the Explore tab, which you’ll find under Reports in the main sidebar menu on the left-hand side of the page. In here, you’ll find custom report templates that let you explore your analytics in more detail.
In the example above, I created a custom report to compare how users in the US and Direct traffic segments behaved between different steps in the sales funnel. I admit, this took a bit of time to get my head around – the interface is very cluttered, and it’s not easy to understand how to set everything up.
That said, if you’re ready to take the next step, custom reports can help you understand how different data points interact. You can use this to set up extremely specific advertising campaigns, or simply to further understand how users behave over their logged lifetime.
Troubleshooting Common Google Analytics 4 Issues
Here are some common issues you might run into and how to fix them. Don’t worry if you need to try a few different solutions – even experienced users sometimes need to experiment to get things working properly.
- Google tag errors. Check that your Google tag is installed correctly. If the linked method doesn’t work, then use DebugView in Google Tag Manager. You’ll need to modify your tag’s settings. You can then see events as they’re triggered, which can help you narrow down the issue.
- No data showing in GA4. Wait 48 hours, as data delivery can sometimes be delayed. After this, check that your tag is installed correctly and make sure you’re looking at the correct date range. You should also verify that your ad blocker isn’t turned on – if you’re the only one visiting your website, ad blockers might stop your data from being collected.
- Data is unusually low. Check to see if your website’s privacy banner is blocking tracking. You should also verify that your GA4 consent settings are properly configured to allow tracking if visitors consent. You could also set up a custom report to compare with previous periods to spot any hidden patterns.
- Seeing duplicate events. Look for multiple tracking codes on the same page. Then, check to see if you have overlapping event triggers. Failing that, review your Google Tag Manager setup.
- Traffic sources are incorrect. Ensure that URL parameters are tracking properly – some might not track based on your consent settings. Otherwise, check if your filters are too restrictive, and verify your domain settings are correct.
Why You Should Add Google Analytics 4 to Your Toolbelt
GA4 is a powerful analytics platform with capabilities far beyond what we’ve covered in this guide. While we’ve focused on the essential features you can use right away, there’s much more to explore. The platform is incredibly flexible, allowing you to compare and analyze almost any combination of data points you can imagine.
The insights you gain will help you make smarter marketing decisions, create more effective advertising campaigns, and ultimately increase your website’s revenue. Start with these fundamentals, and you’ll be well on your way to making data-driven decisions for your business.